The Toll Index was first proposed in IZA DP5522 which was published in the Journal of Forecasting. It has been widely covered in national and international media (selection):
The Toll index was redefined in 2024 to account for various toll-related policy changes like including lighter trucks in the system or adding roads to the toll road network.
Citation: “Nowcasting business cycles using toll data.” Journal of Forecasting 32:4 (2013): 299–306(with K. F. Zimmermann).
Generative AI (GenAI) and Large Language Models (LLMs) are moving into domains once seen as uniquely human—reasoning, synthesis, abstraction, and rhetoric. Addressed to (labor) economists and informed readers, this paper clarifies what is truly new about LLMs, what is not, and why it matters. Using an analogy to autoregressive models from economics, we explain their stochastic nature, whose fluency is often mistaken for agency. We situate LLMs in the longer history of human–machine outsourcing, from digestion to cognition, and examine disruptive effects on white-collar labor, institutions, and epistemic norms. Risks emerge when synthetic content becomes both product and input, creating feedback loops that erode originality and reliability. Grounding the discussion in conceptual clarity over hype, we argue that while GenAI may substitute for some labor, statistical limits will preserve a key role for human judgment. The question is not only how these tools are used, but which tasks we relinquish and how we reallocate expertise in a new division of cognitive labor.
We examine the uptake and measurable effects of GPT-assisted writing in economics working paper abstracts. Focusing on the IZA discussion paper series, we detect a significant stylistic shift following the public release of ChatGPT-3.5 in March 2023. This shift appears in core textual metrics—including mean word length, type-token ratio, and readability—and reflects growing alignment with machine-generated writing. While the release of ChatGPT constitutes an exogenous technological shock, adoption is endogenous: authors choose whether to incorporate AI assistance. To capture and estimate the magnitude of this behavioral response, we combine stylometric analysis, machine learning classification, and prompt-based similarity testing. Event-study regressions with fixed effects and placebo checks confirm that the observed shift is abrupt, persistent, and not attributable to pre-existing trends. A similarity experiment using OpenAI’s API shows that post-ChatGPT abstracts more closely resemble their GPT-optimised counterparts than do pre-ChatGPT texts. A classifier trained on these variants achieves 97% accuracy and increasingly flags post-March 2023 abstracts as GPT-like. Rather than indicating wholesale substitution, our findings suggest selective human–AI augmentation in professional writing. The framework introduced here generalises to other settings where writing plays a central role—including resumes, job descriptions, legal briefs, research proposals, and software documentation.
The Toll Index was first proposed in IZA DP5522 which was published in the Journal of Forecasting. It has been widely covered in national and international media (selection):
The Toll index was redefined in 2024 to account for various toll-related policy changes like including lighter trucks in the system or adding roads to the toll road network.
Citation: “Nowcasting business cycles using toll data.” Journal of Forecasting 32:4 (2013): 299–306(with K. F. Zimmermann).
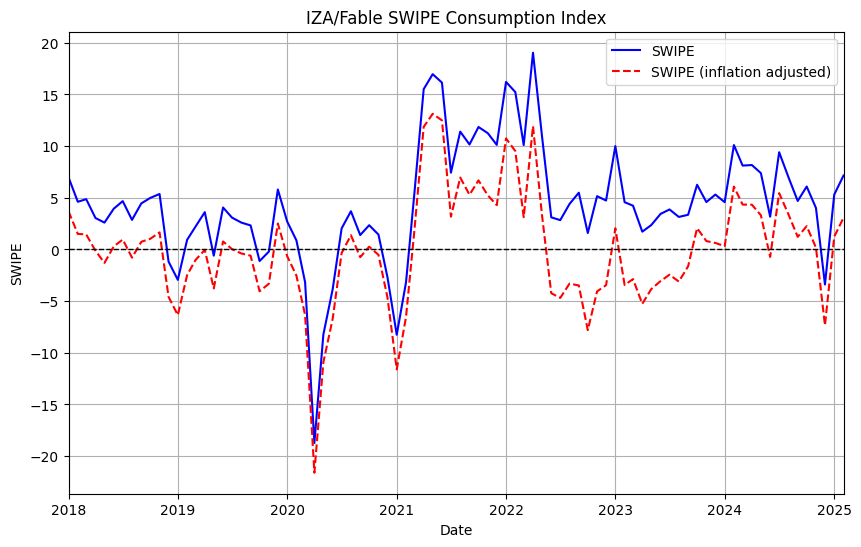
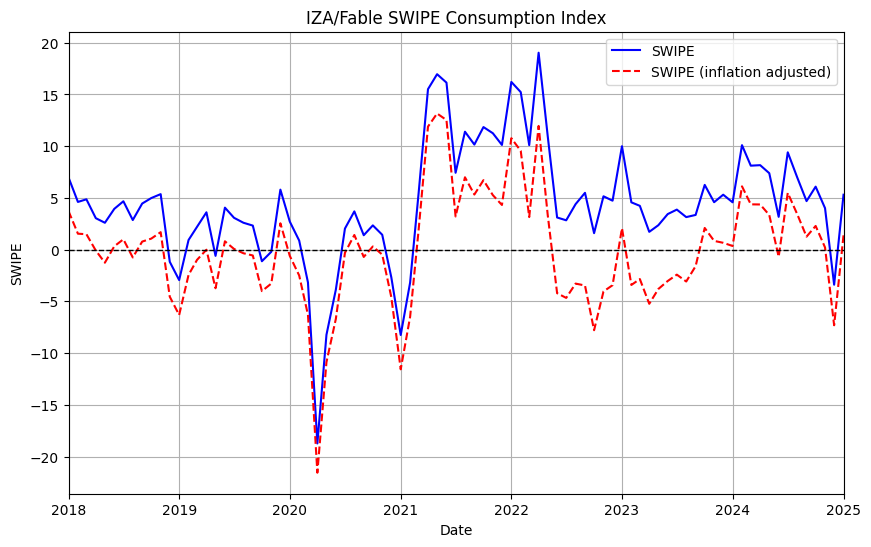
The 14-day month-to-date data for February 2025 shows a 7% year-over-year increase in consumption.
This initial “flash estimate” compares the first 14 days of February 2025 with the same period in February 2024 and should not be interpreted as the final year-over-year figure for February. As new data arrives daily, we will calculate 15-day, 16-day, and subsequent month-to-date partials until a stable value is reached, typically about three days into March. Stay tuned, and follow daily updates via the embedded live graph or at https://fable.radar.iza.org.
Note: The inflation-adjusted SWIPE index in the graph above assumes February 2025 inflation matches January 2025 levels.
Final January 2025 Consumption Data Shows Stronger Growth Than Initial Estimates
On January 22, I reported a 5.31% year-over-year increase in consumption based on the first 14 days of January 2025. This “flash estimate” provided an early indication of growth, comparing the initial two weeks of January 2025 to the same period in January 2024.
Now, with the complete data for January, I can confirm that the consumption index has stabilized at slightly above 6.5% year-over-year growth. This final figure not only exceeds the early estimate but also represents a notable rebound from December’s performance.
As anticipated, daily data updates refined the initial understanding, with the index reaching stability just a few days into February. This highlights the value of this dynamic, month-to-date tracking approach, offering timely insights while capturing the evolving picture as new data arrives.
Stay tuned for continuous updates, and explore the latest trends via the embedded live graph or directly at https://fable.radar.iza.
Even adjusting for inflation (2.8%) for January the index is above board.
The 14-day month-to-date data for January 2025 shows a 5.31% year-over-year increase in consumption.
This initial “flash estimate” compares the first 14 days of January 2025 with the same period in January 2024 and should not be interpreted as the final year-over-year figure for January. As new data arrives daily, we will calculate 15-day, 16-day, and subsequent month-to-date partials until a stable value is reached, typically about three days into February. Stay tuned, and follow daily updates via the embedded live graph or at https://fable.radar.iza.org.
Note: The inflation-adjusted SWIPE index in the graph above assumes January 2025 inflation matches December 2024 levels.
The Toll Index was first proposed in IZA DP5522 which was published in the Journal of Forecasting. It has been widely covered in national and international media (selection):
The Toll index was redefined in 2024 to account for various toll-related policy changes like including lighter trucks in the system or adding roads to the toll road network.
Citation: “Nowcasting business cycles using toll data.” Journal of Forecasting 32:4 (2013): 299–306(with K. F. Zimmermann).
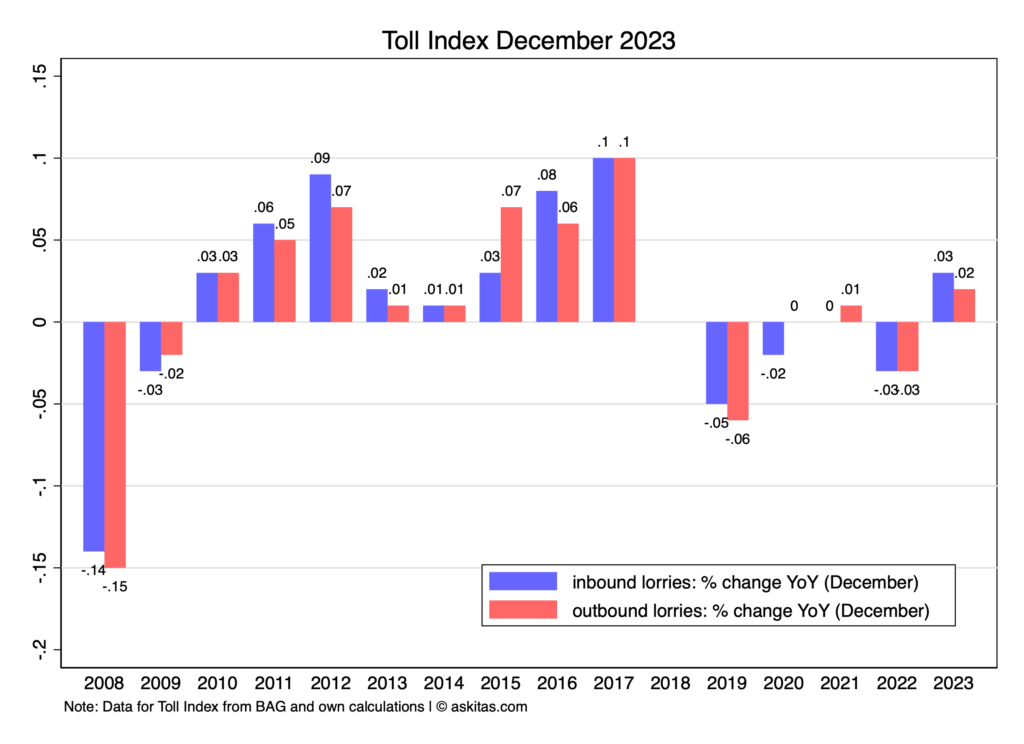
Recent recordings of negative consumer sentiment appear to be translating into consumption restraint this December, as our SWIPE index shows a -3.34% year-over-year change for December 2024.
The uncertainty surrounding the upcoming German general election on February 23, 2025, and the anticipation of the approaching Trump era must have contributed to the mix.
It’s worth noting that the 14-day month-to-date data for December 2024 initially showed a +9.9% year-over-year increase. This spike was due to an unusually late Black Friday, which fell on November 29 this year, compared to November 24 in 2023. Consequently, part of the Black Friday spending, including Cyber Monday purchases, was reflected in the early December comparison.
The December flash estimate of the IZA/Fable SWIPE consumption index shows a 9.9% year-on-year increase in credit card spending in Germany for the first half of the month, compared to the same period in December 2023. The index is updated daily as more data comes in, providing increasingly complete monthly partials, and it remains to be seen how much of this growth will hold by the end of December.
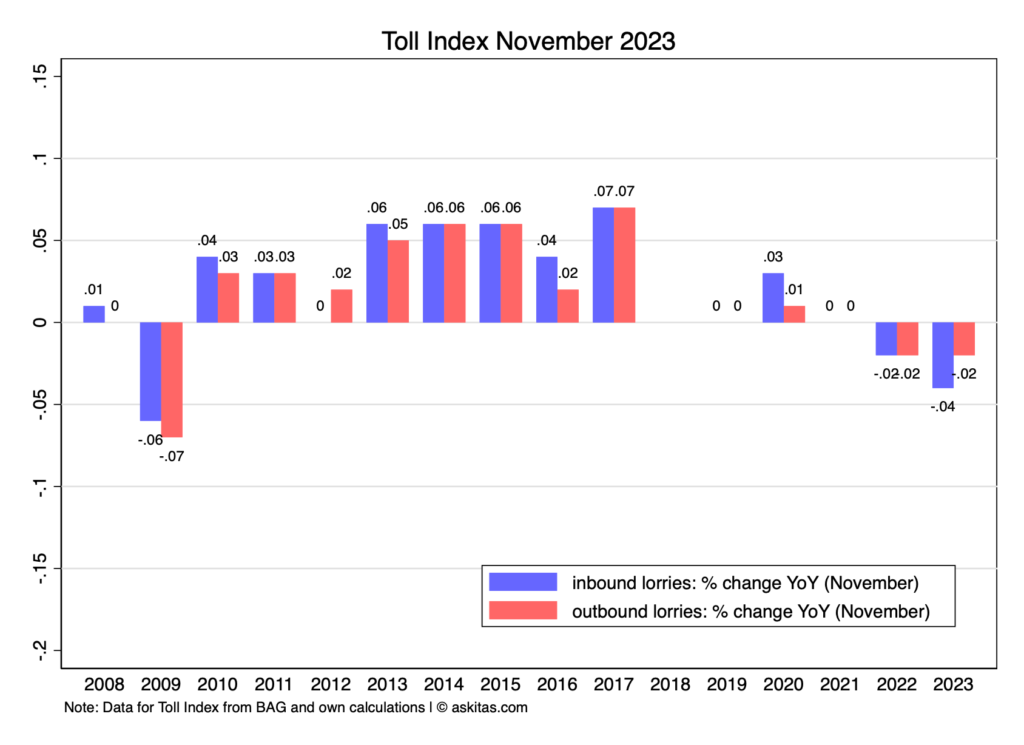
A key factor behind this significant rise is the timing of Black Friday, which fell on November 29 this year, compared to November 24 in 2023. This shift moved part of the Black Friday splurge, including Cyber Monday purchases, from November into December. The late Black Friday also caused the final November consumption growth figure to stabilize at 4%, down from the 6% indicated in the flash estimate.
The Toll Index was first proposed in IZA DP5522 which was published in the Journal of Forecasting. It has been widely covered in national and international media (selection):
The Toll index was redefined in 2024 to account for various toll-related policy changes like including lighter trucks in the system or adding roads to the toll road network.
Citation: “Nowcasting business cycles using toll data.” Journal of Forecasting 32:4 (2013): 299–306(with K. F. Zimmermann).
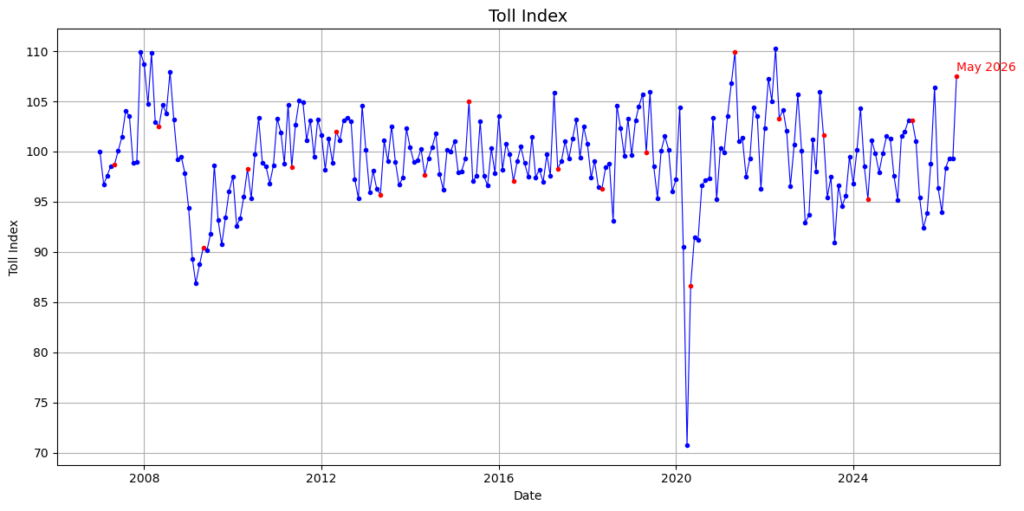
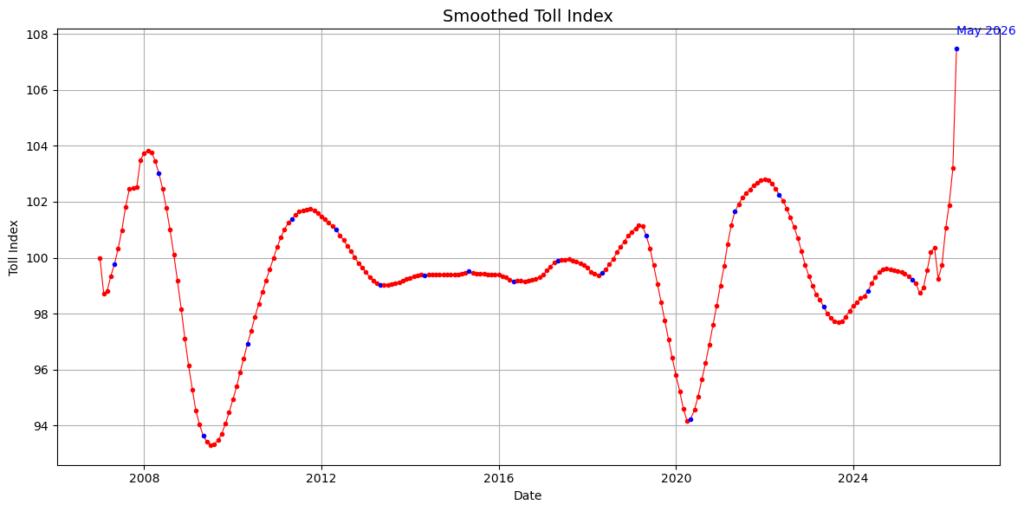
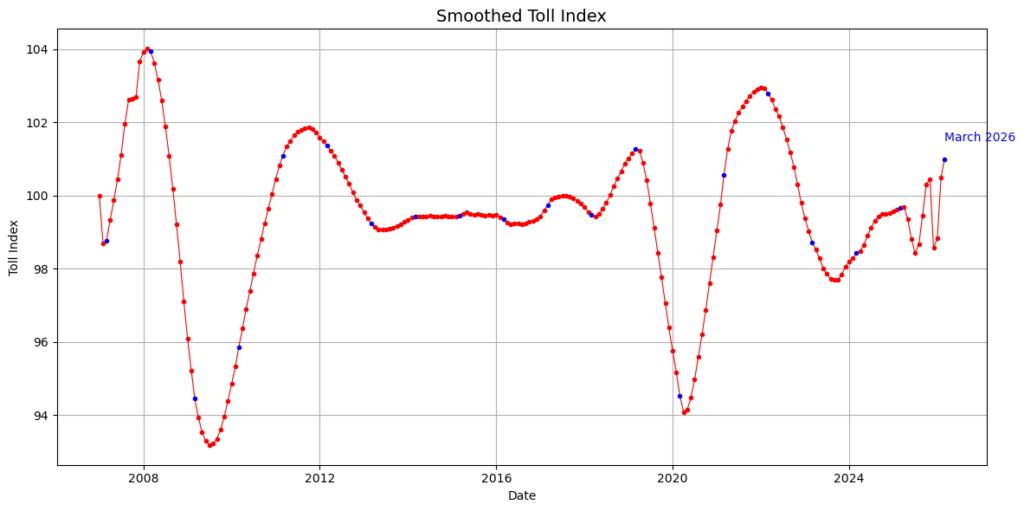
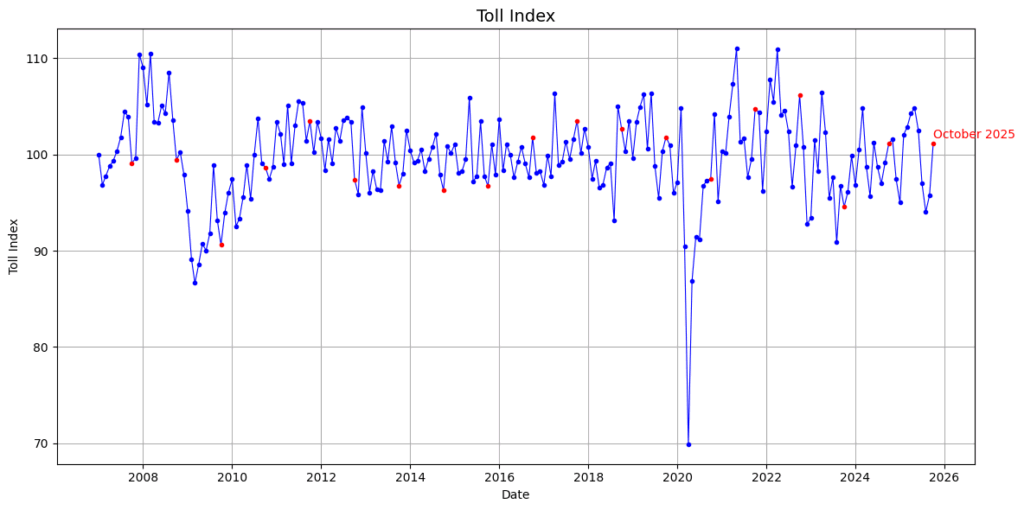
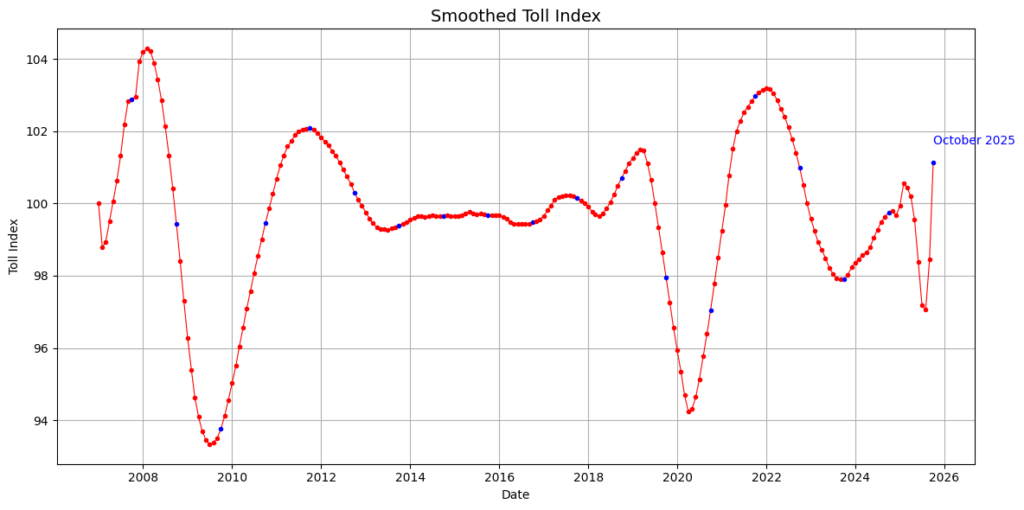
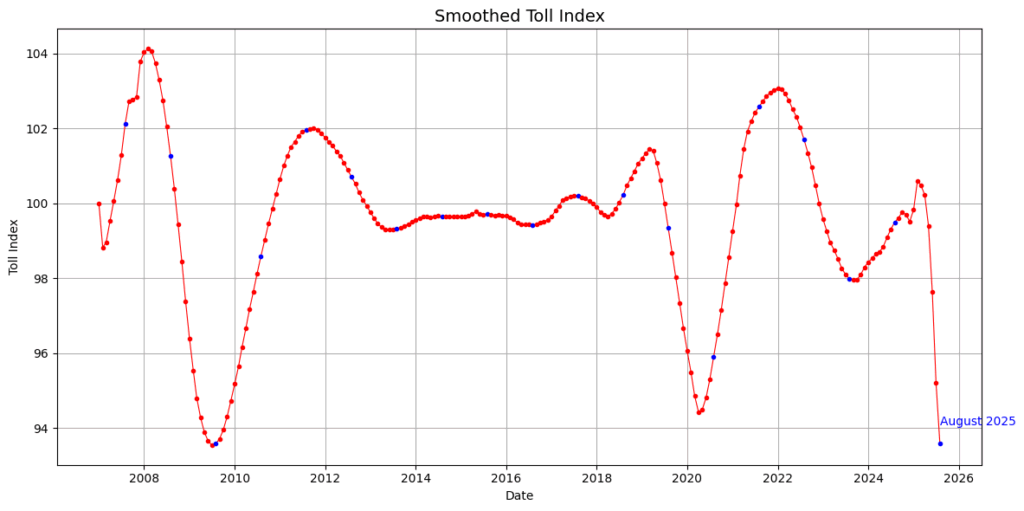
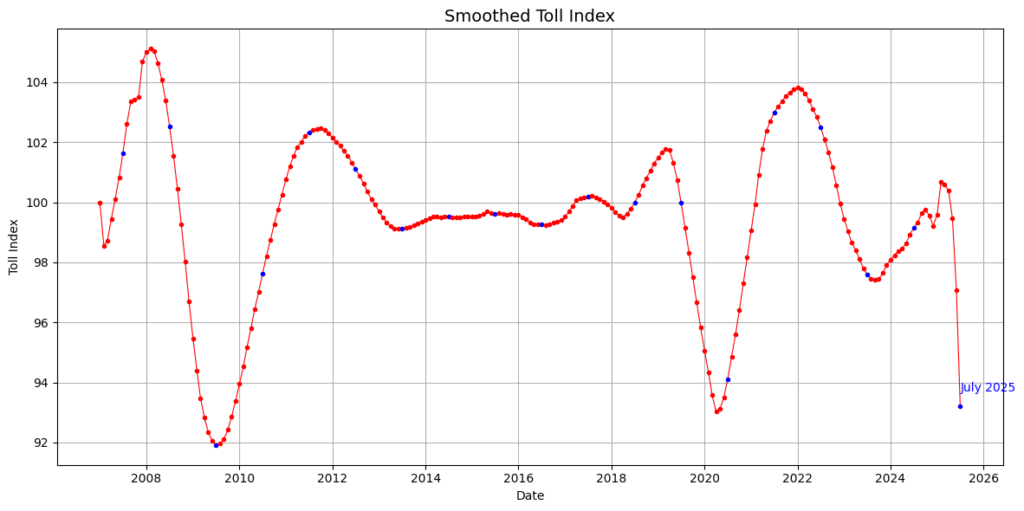
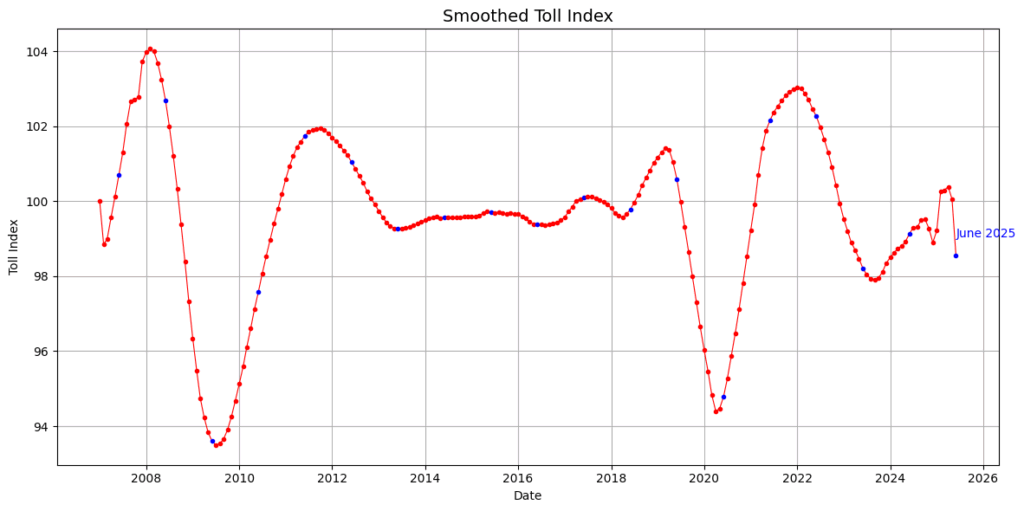
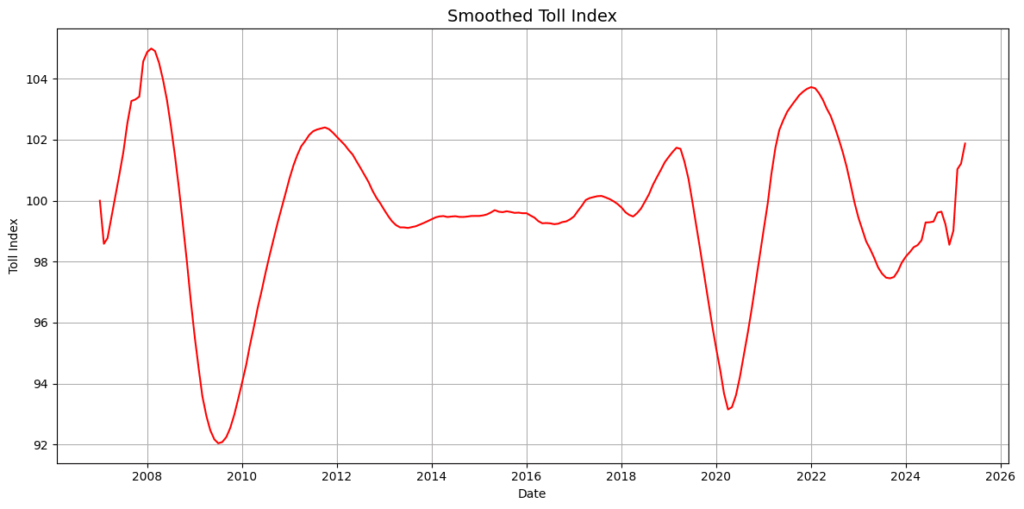
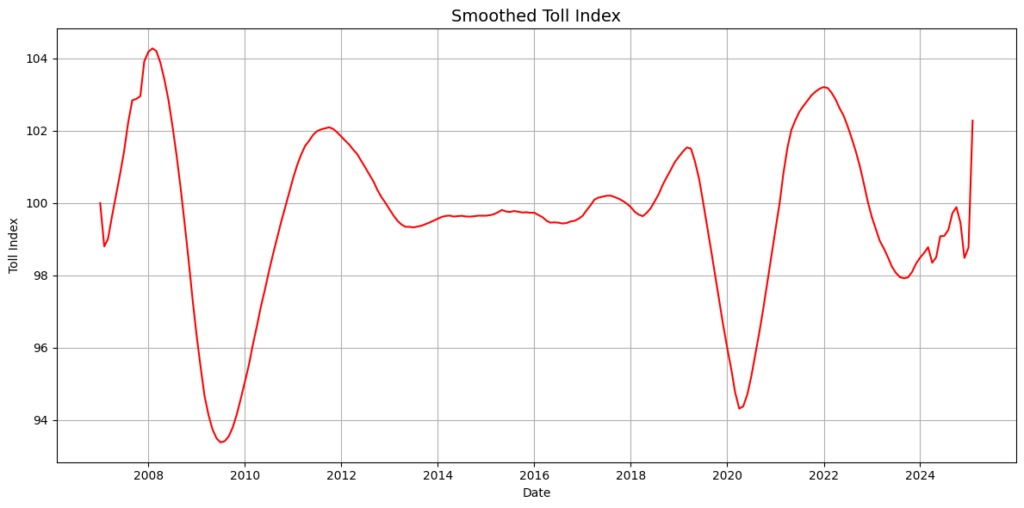
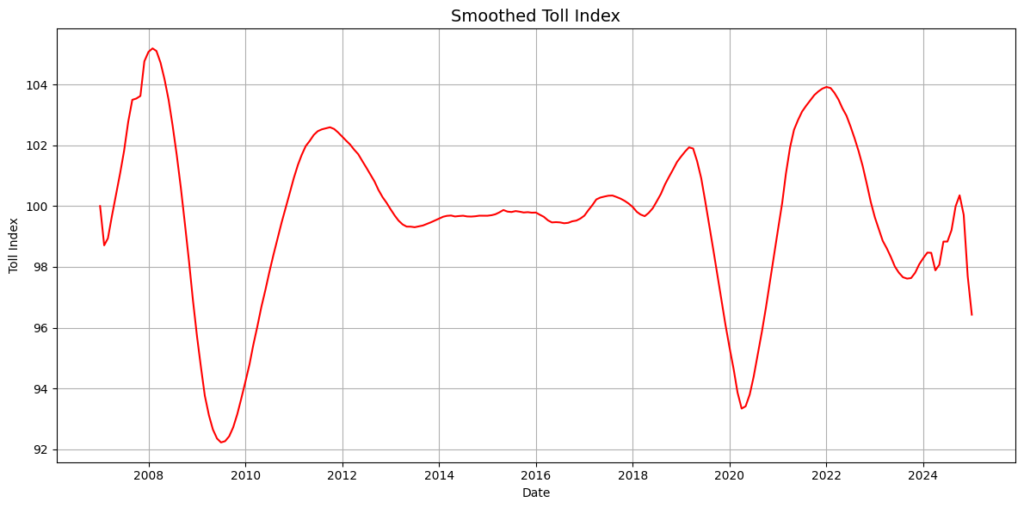
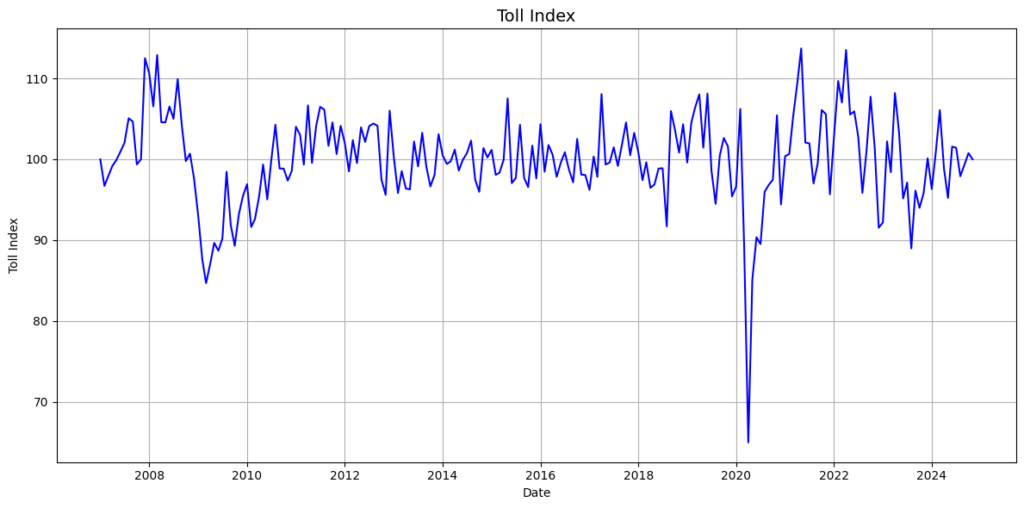
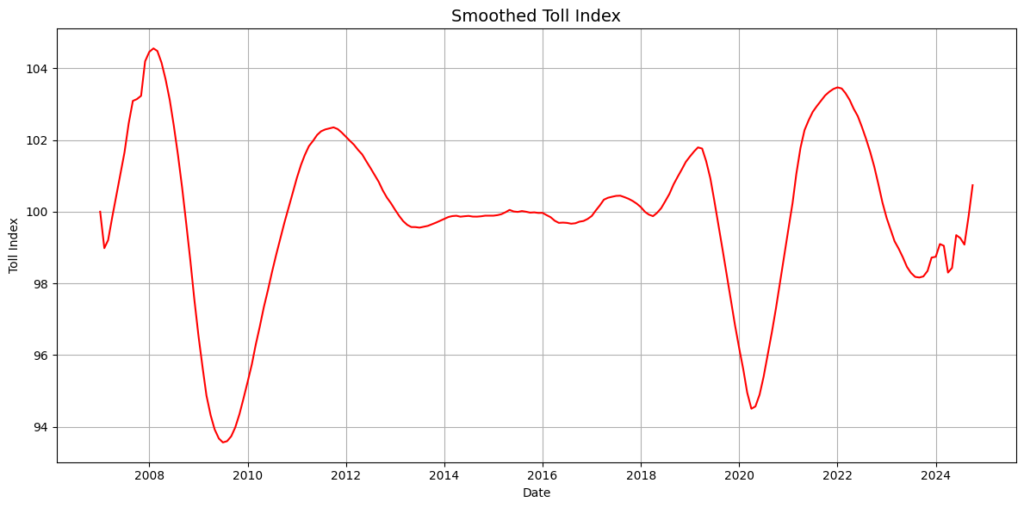
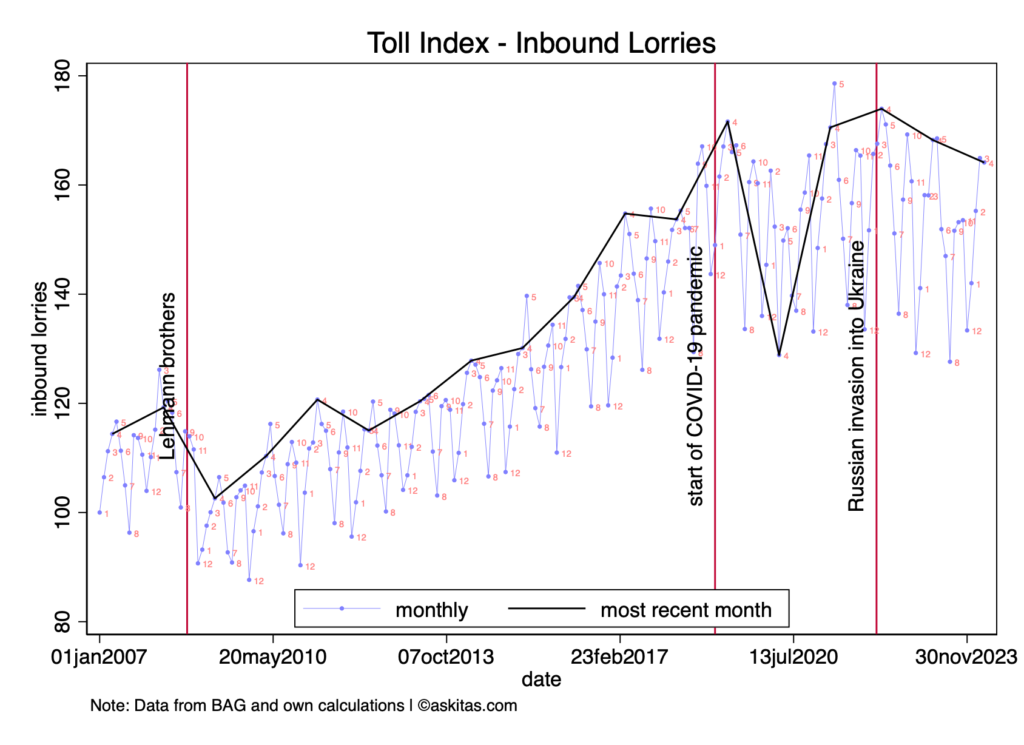
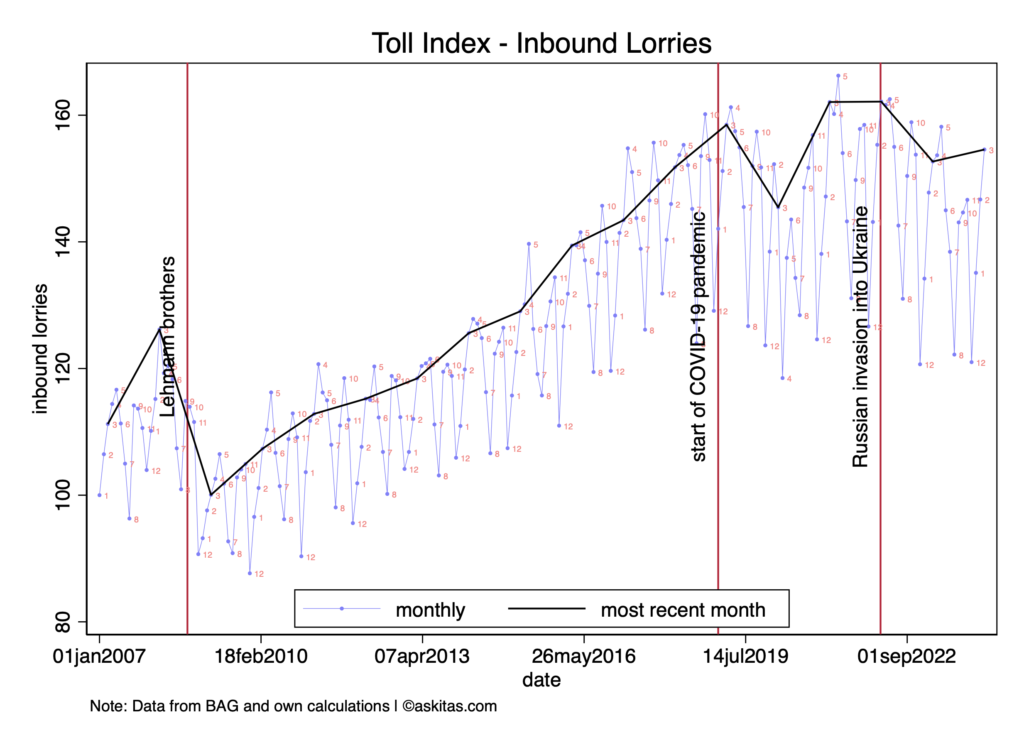
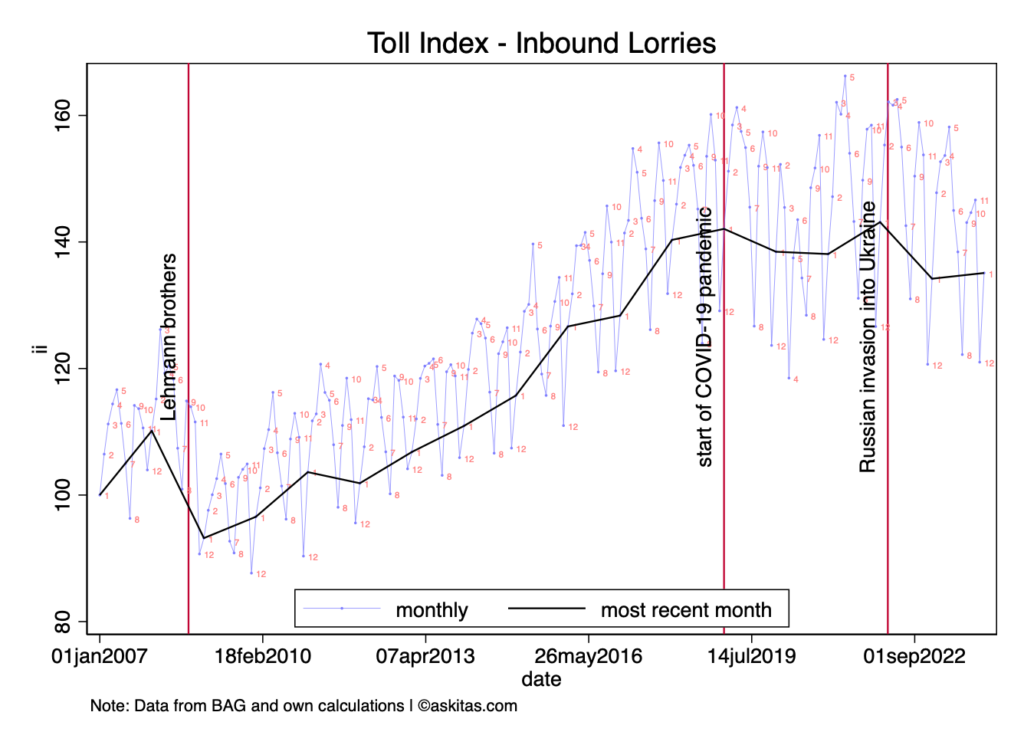
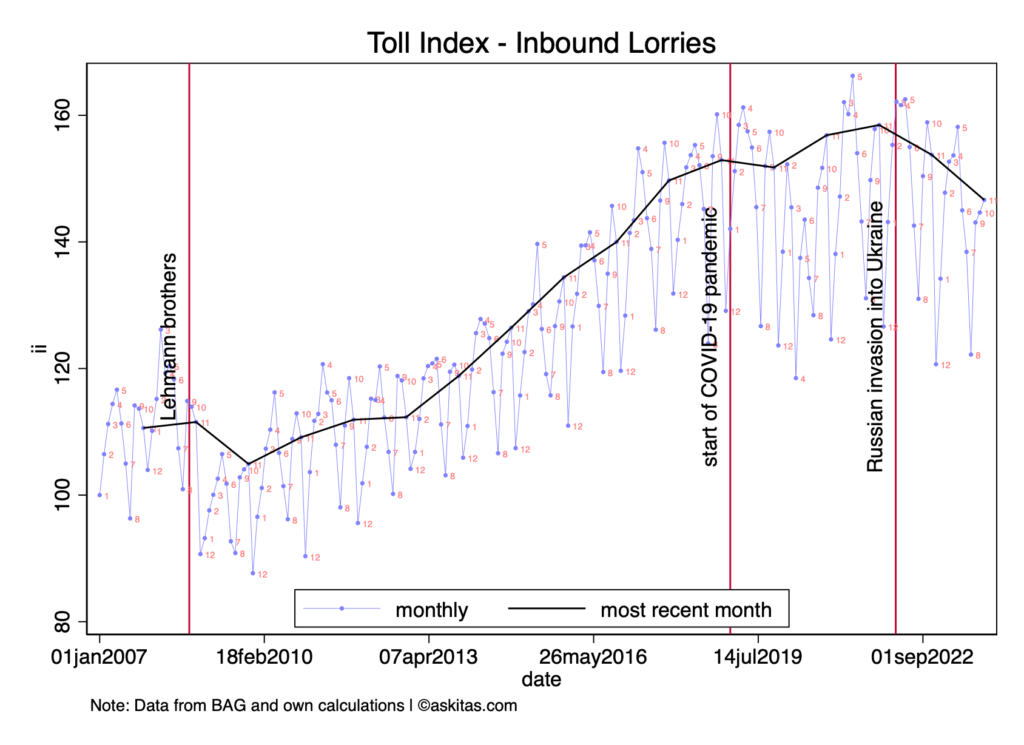
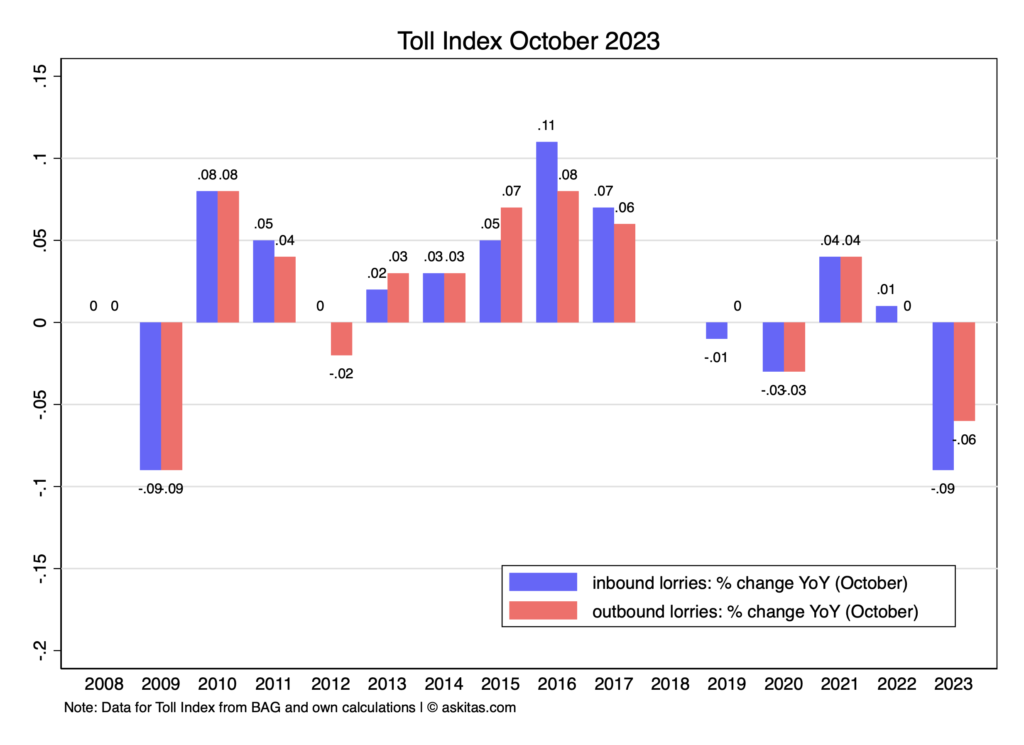
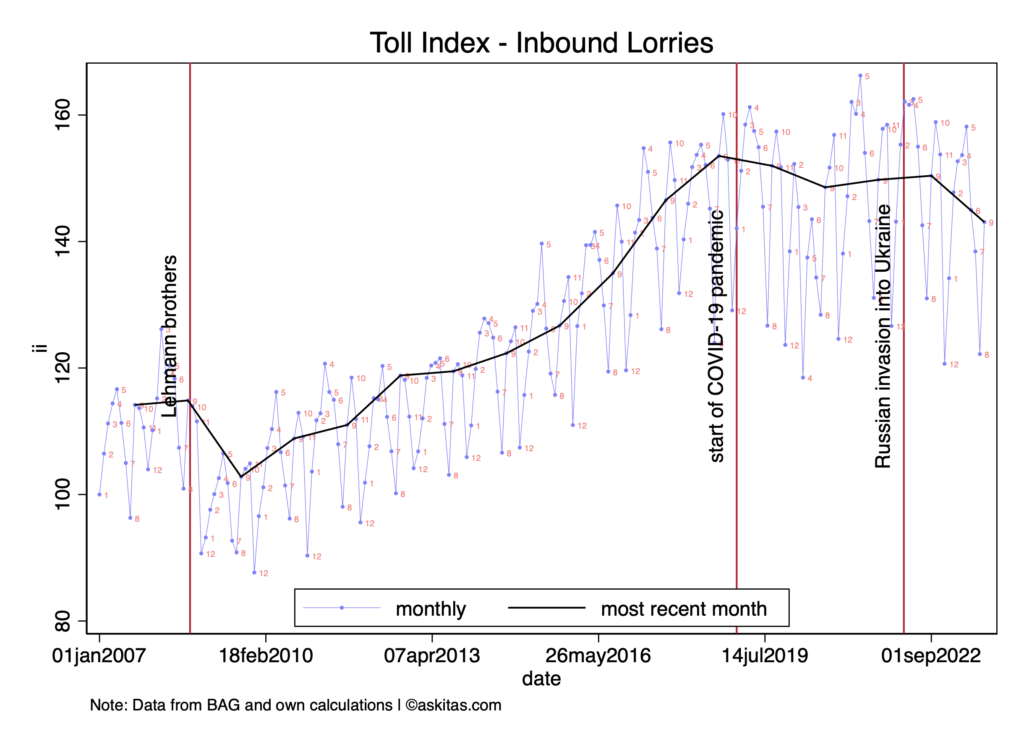
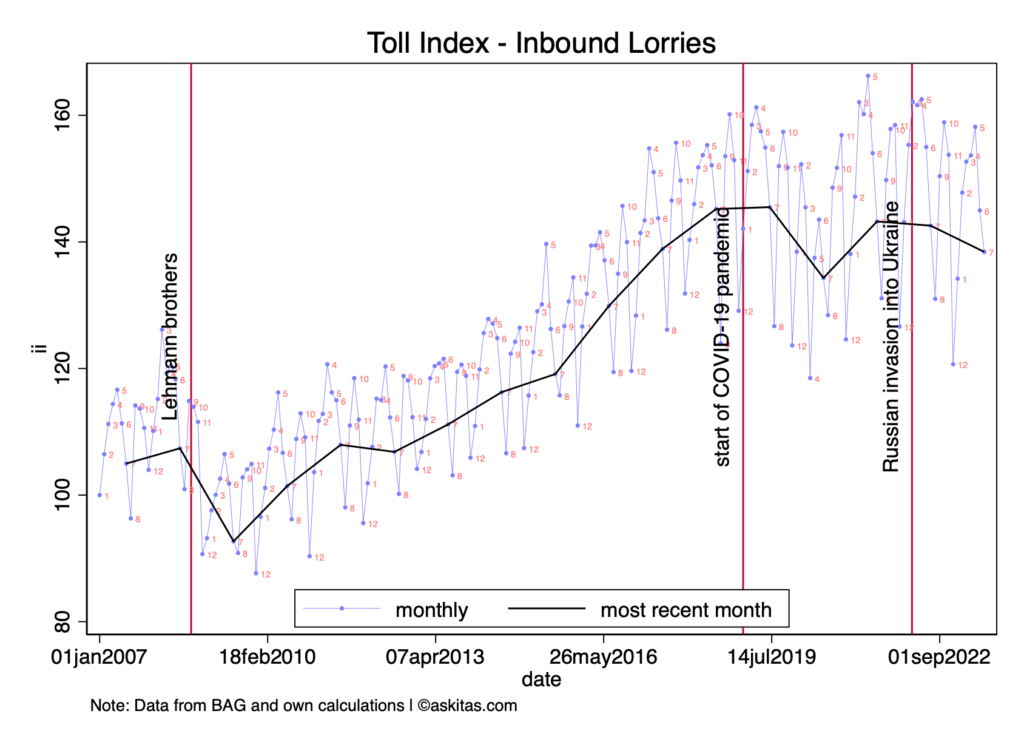
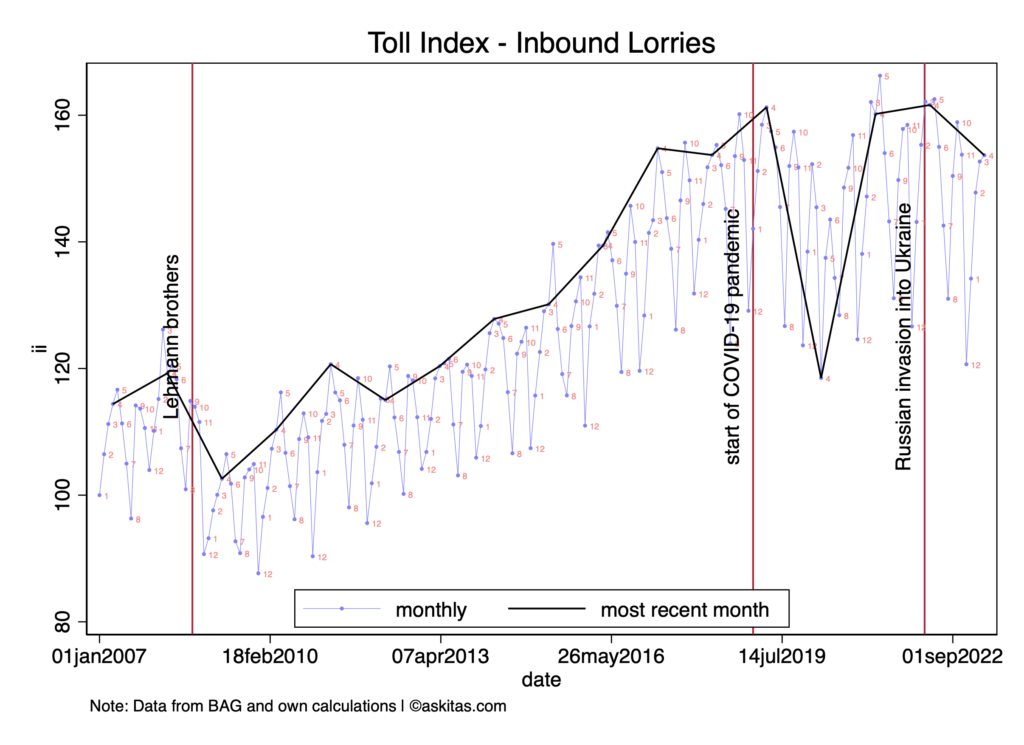
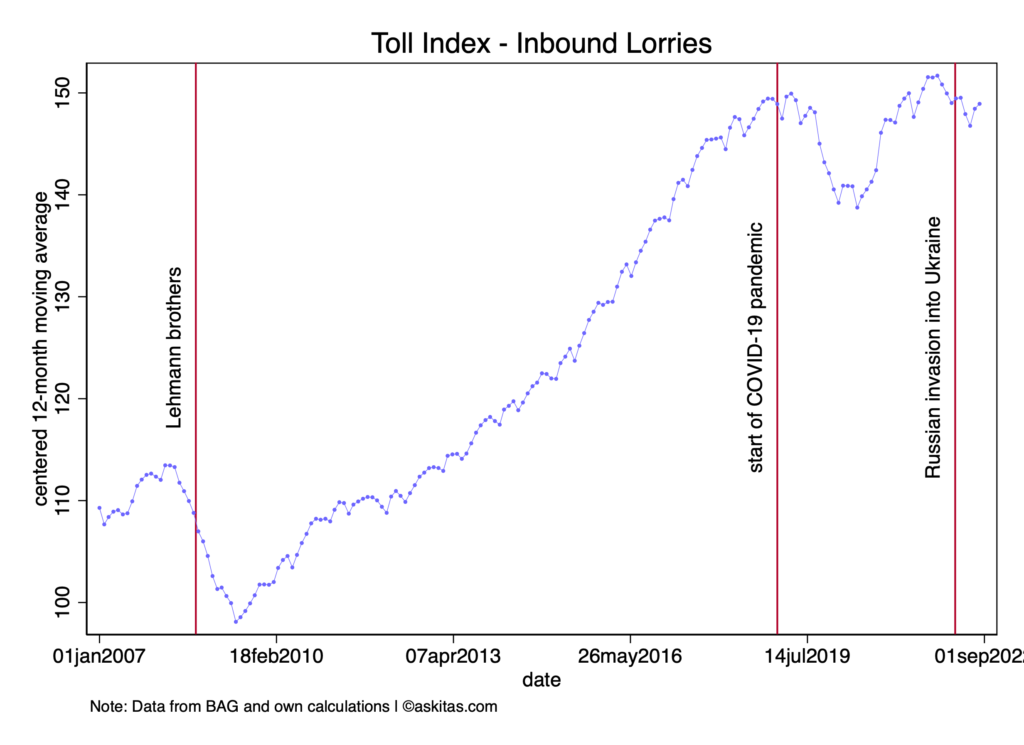
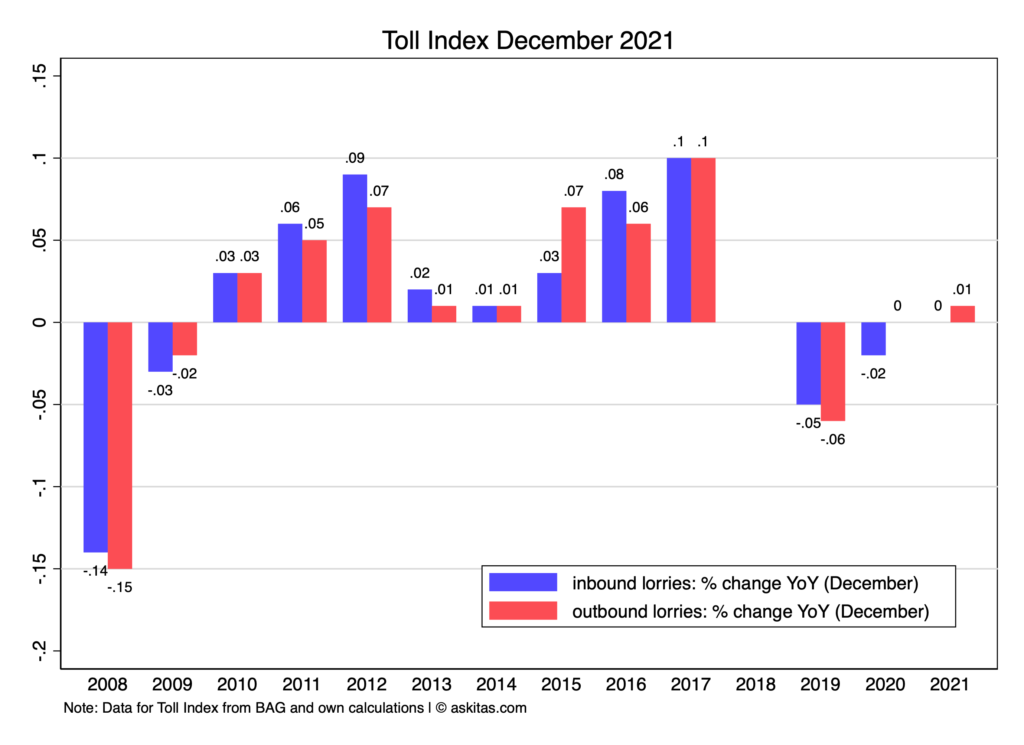
The October value of the Toll Index reads at 100.7 continuing a multi-month positive trend. It is up 1.3% on Steptember 2024 and up 6.1% on October 2023.
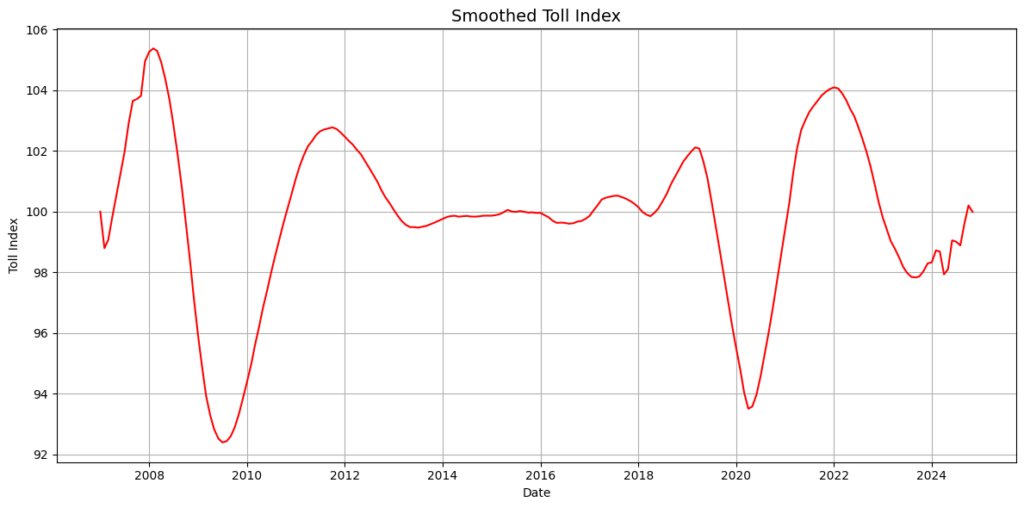
The Border Crossing Toll Index is adjusted for number of weekdays, time, month and MAUT-policy-regime fixed effects. For the newly defined Toll Index see here. The smoothing used is what I call the eye-balling smoothing.
The Toll Index was first proposed in IZA DP5522 which was published in the Journal of Forecasting. It has been widely covered in national and international media (selection):
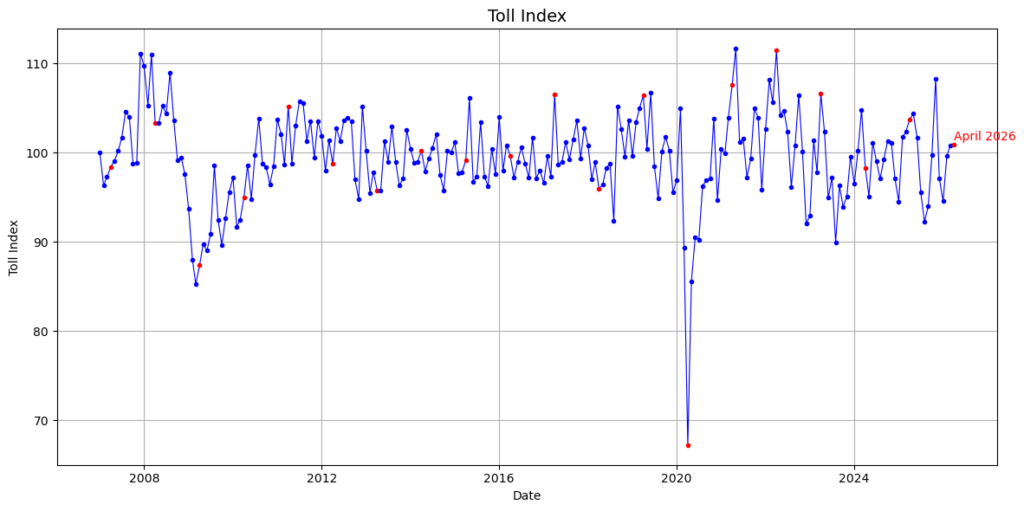
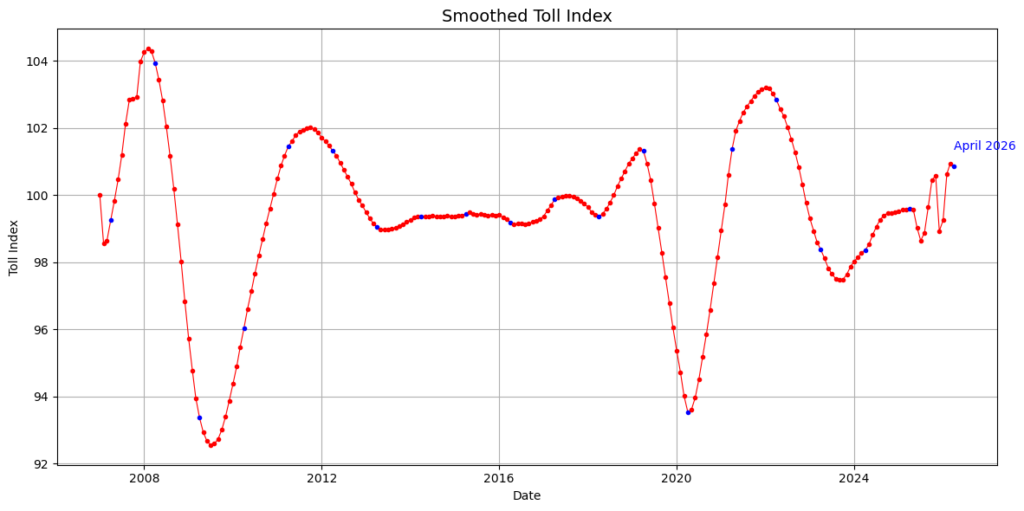
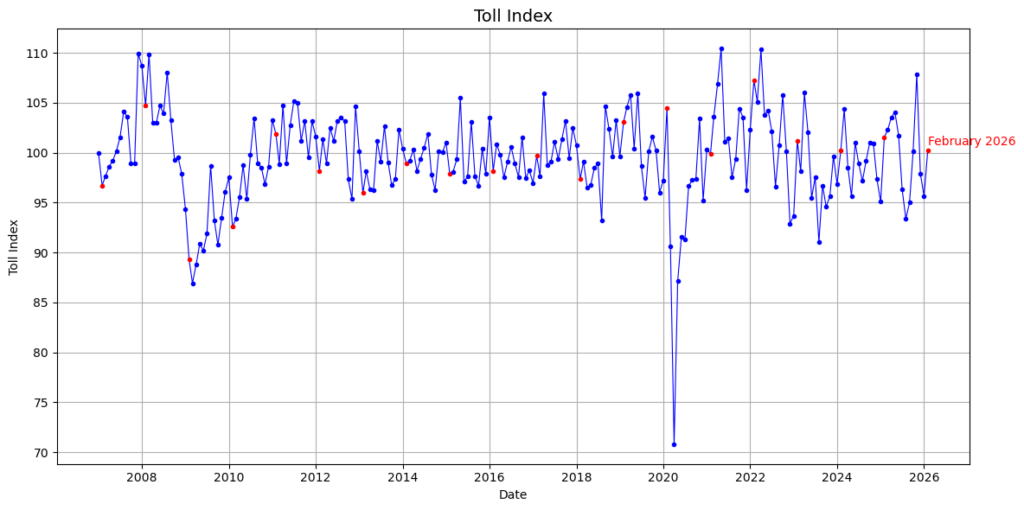
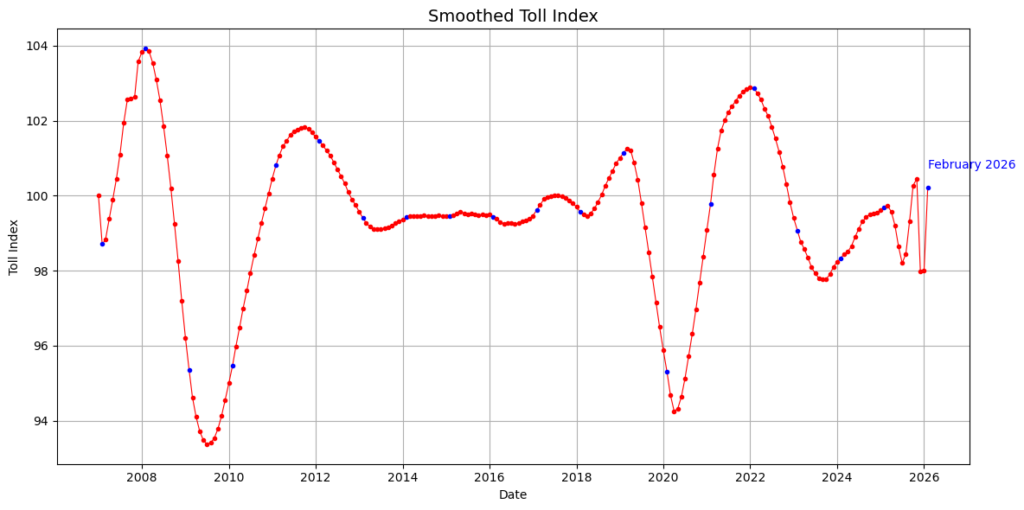
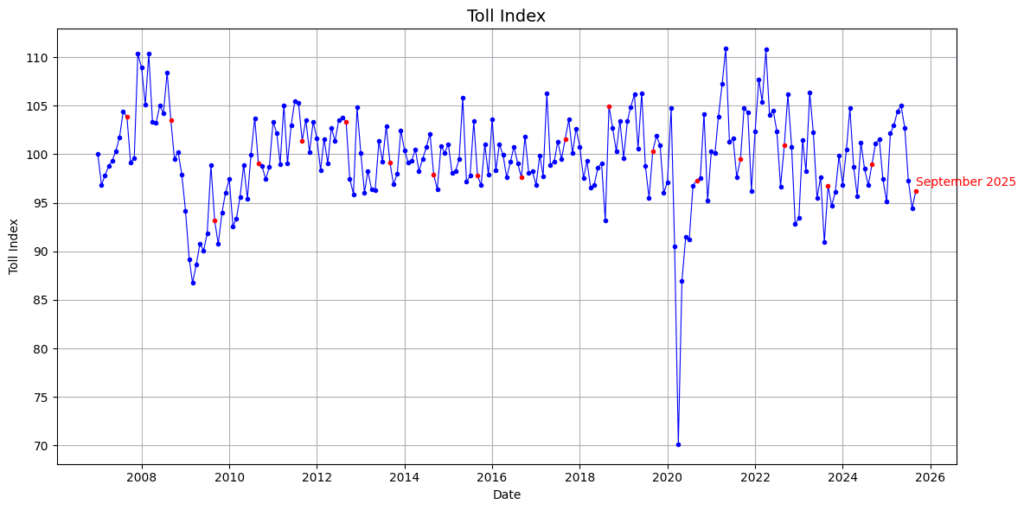
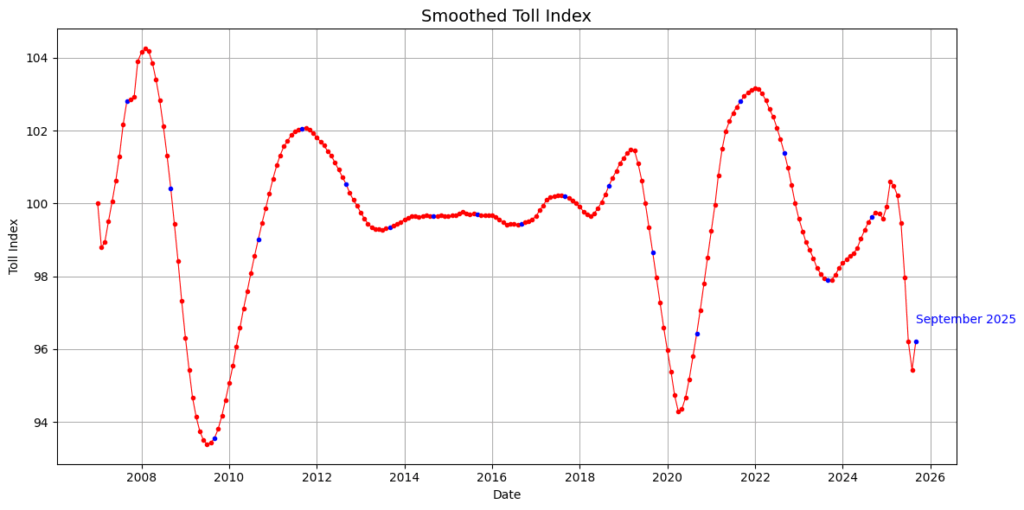
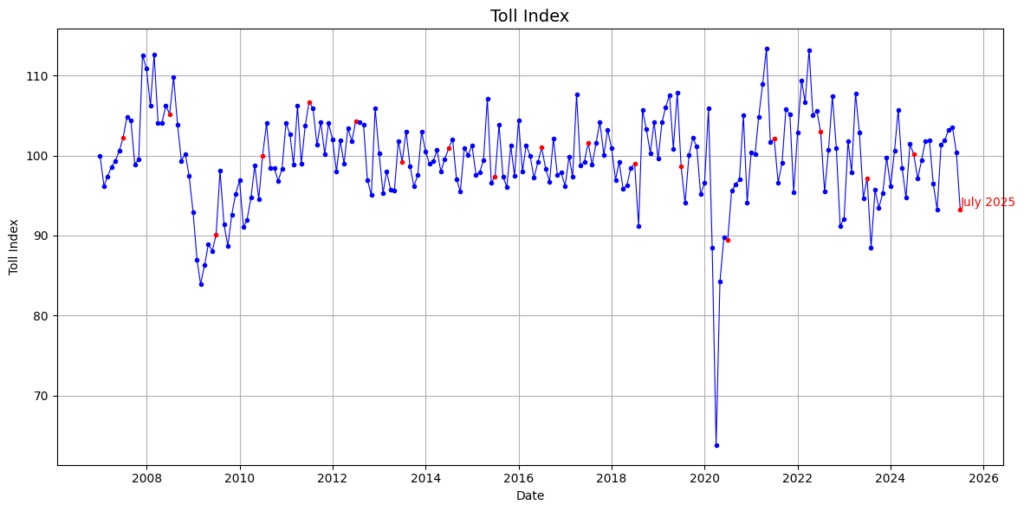
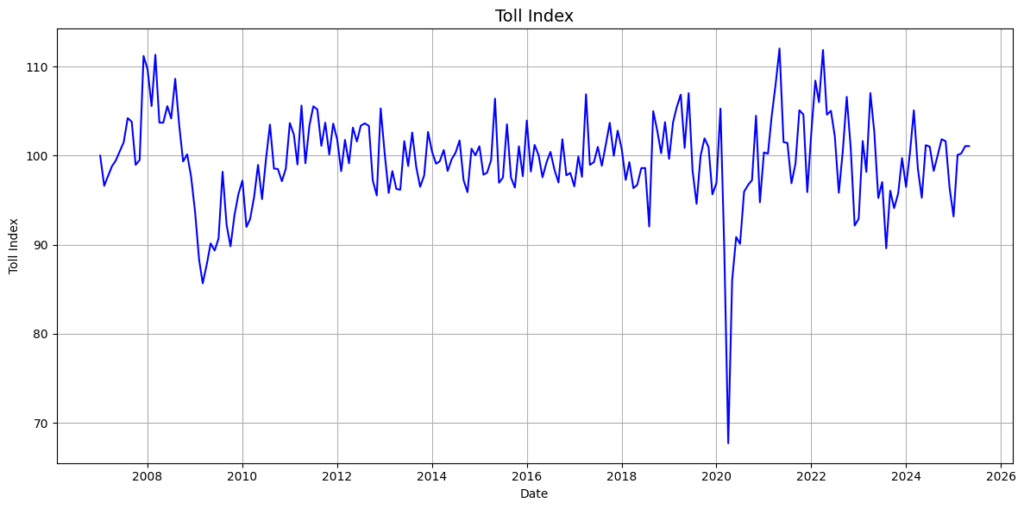
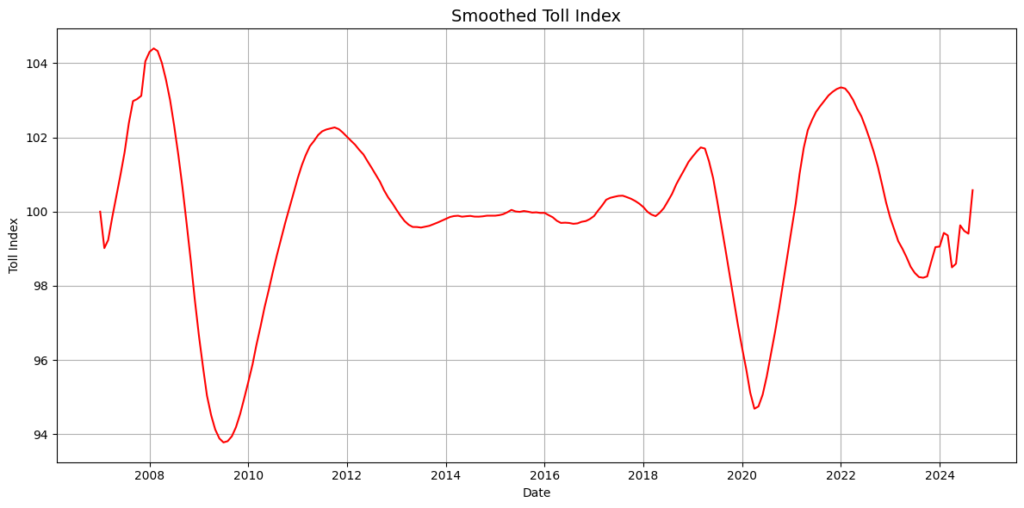
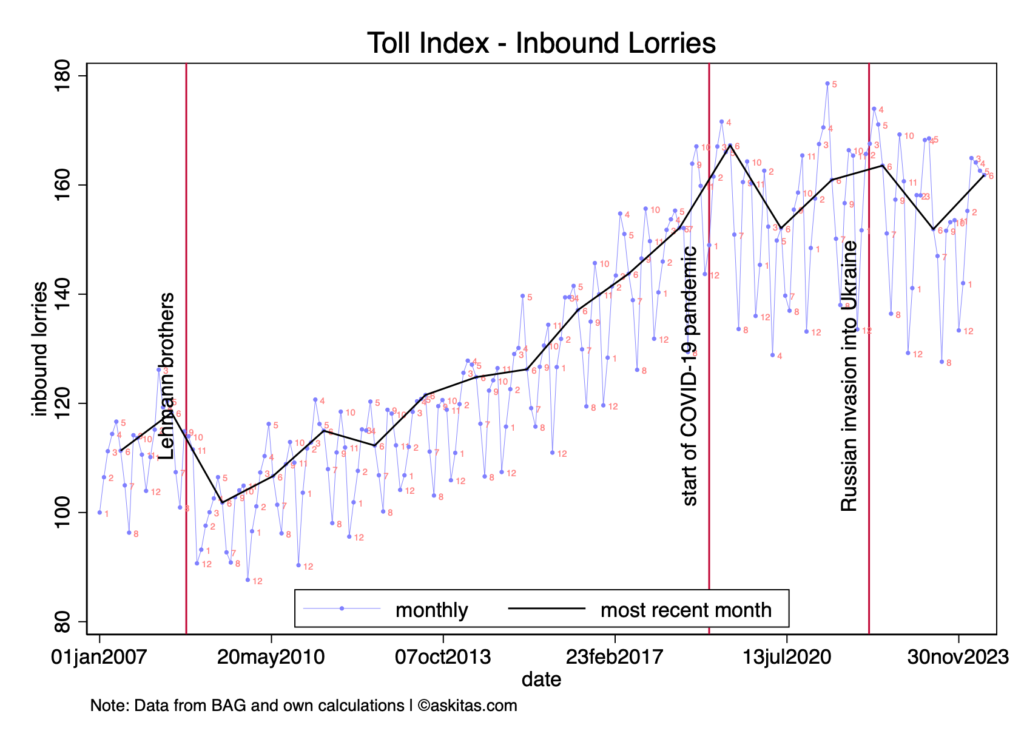
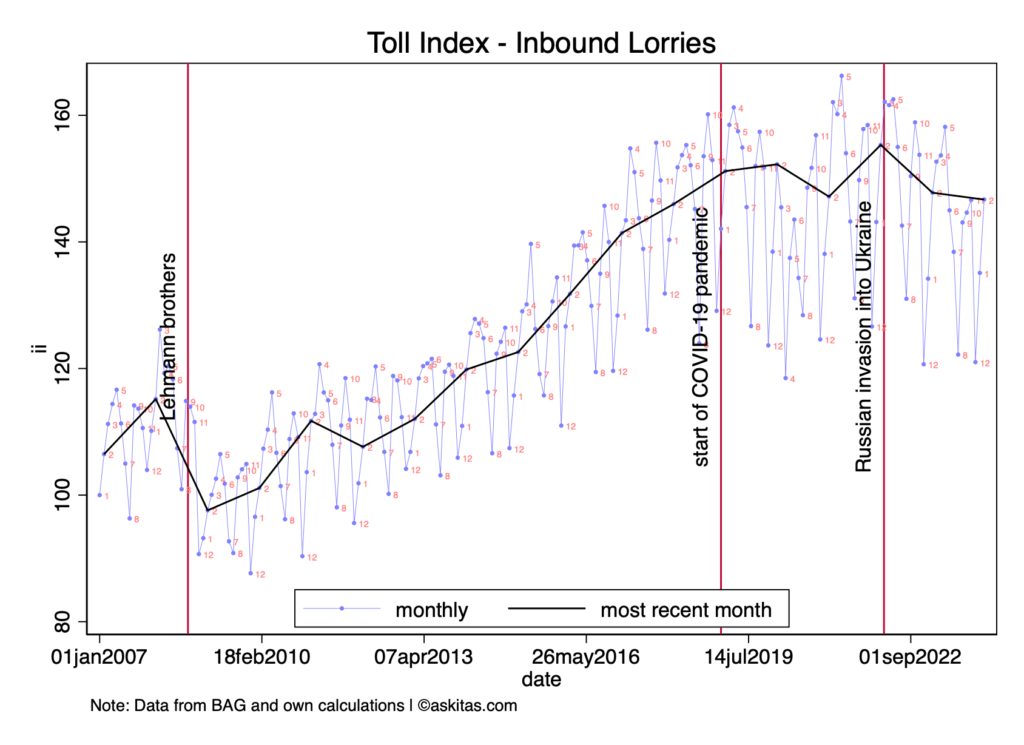
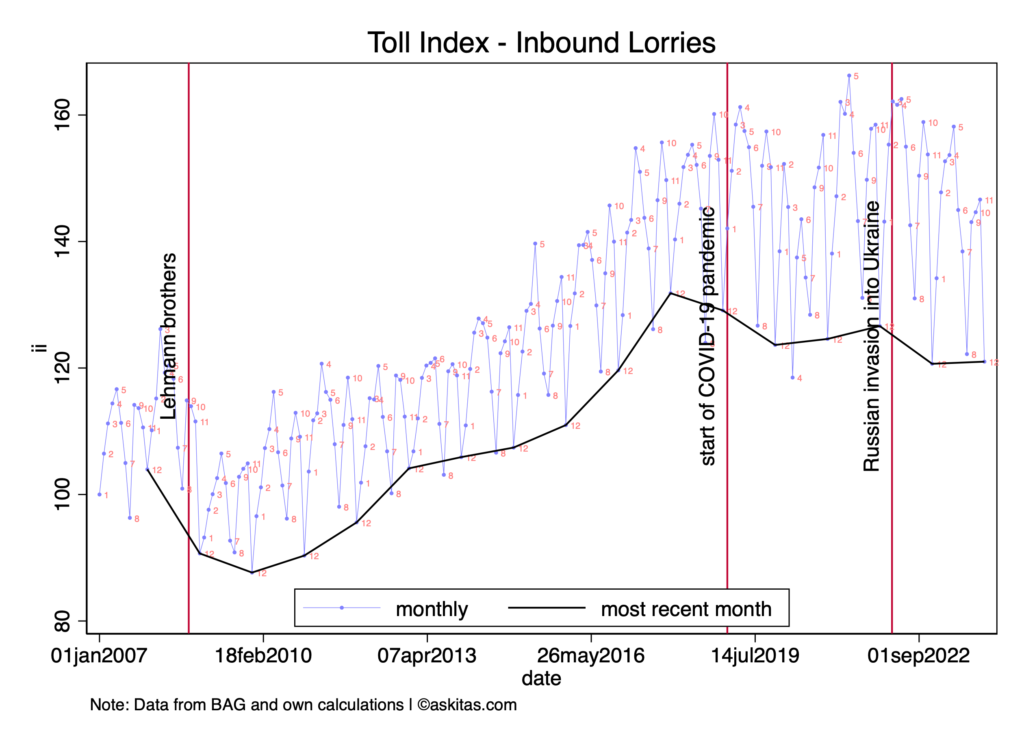
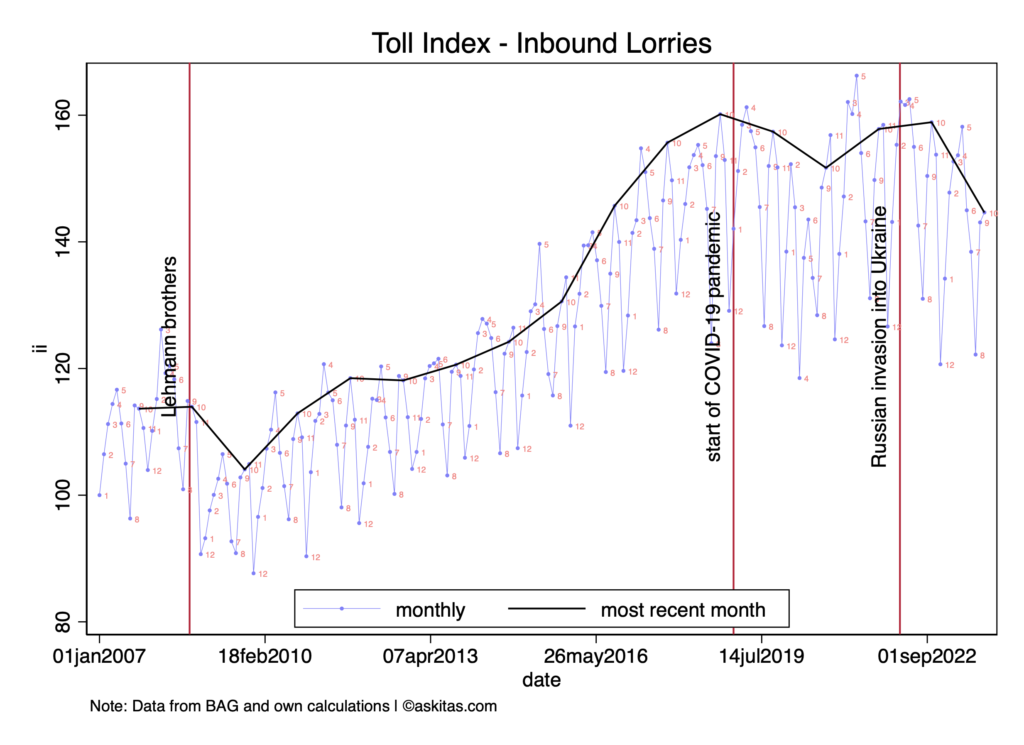
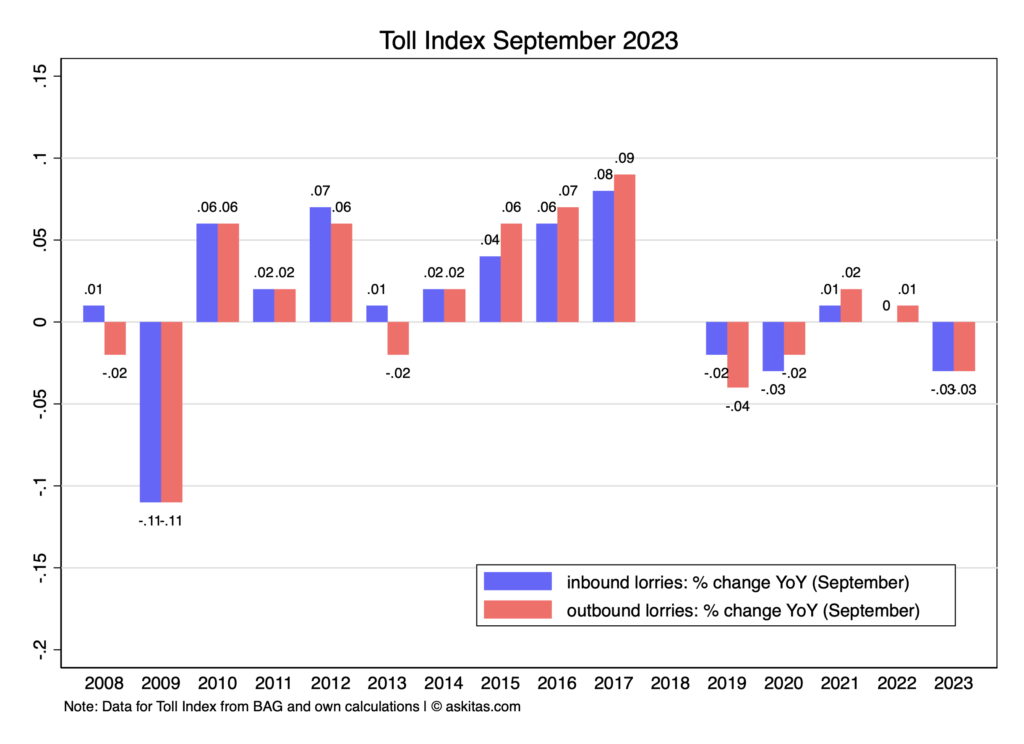
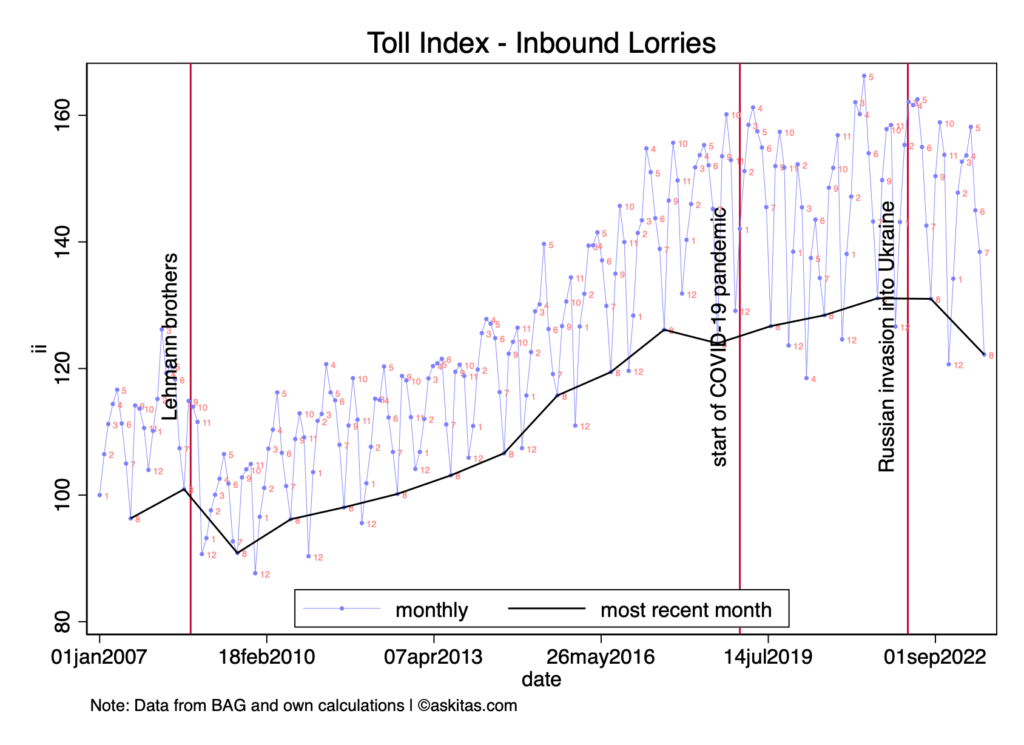
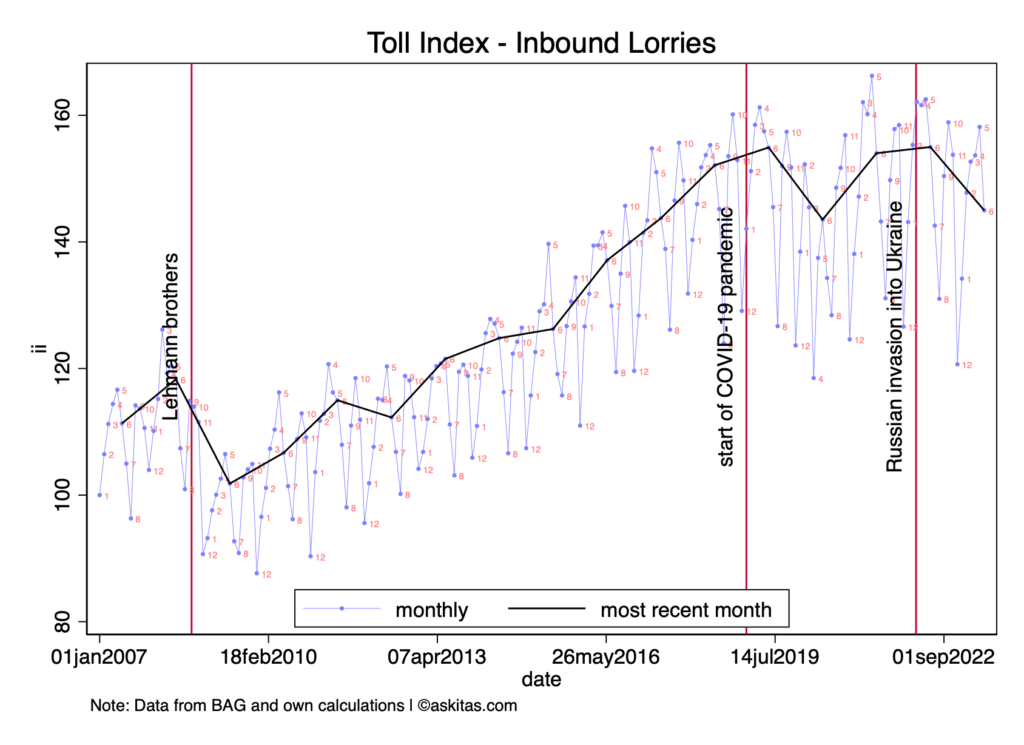
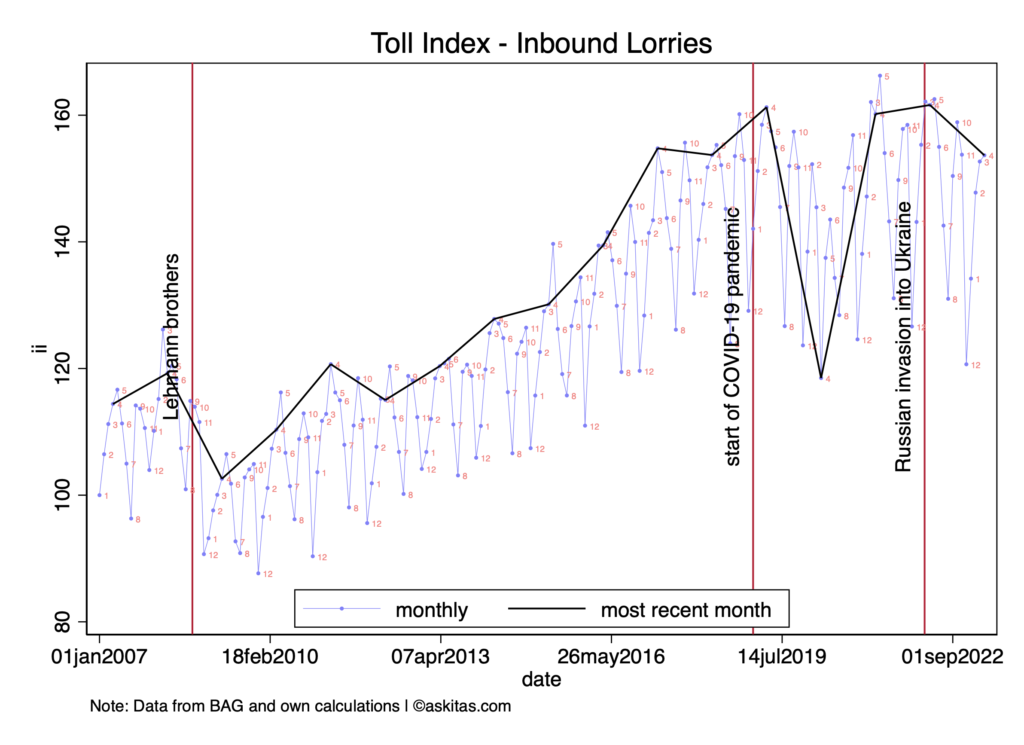
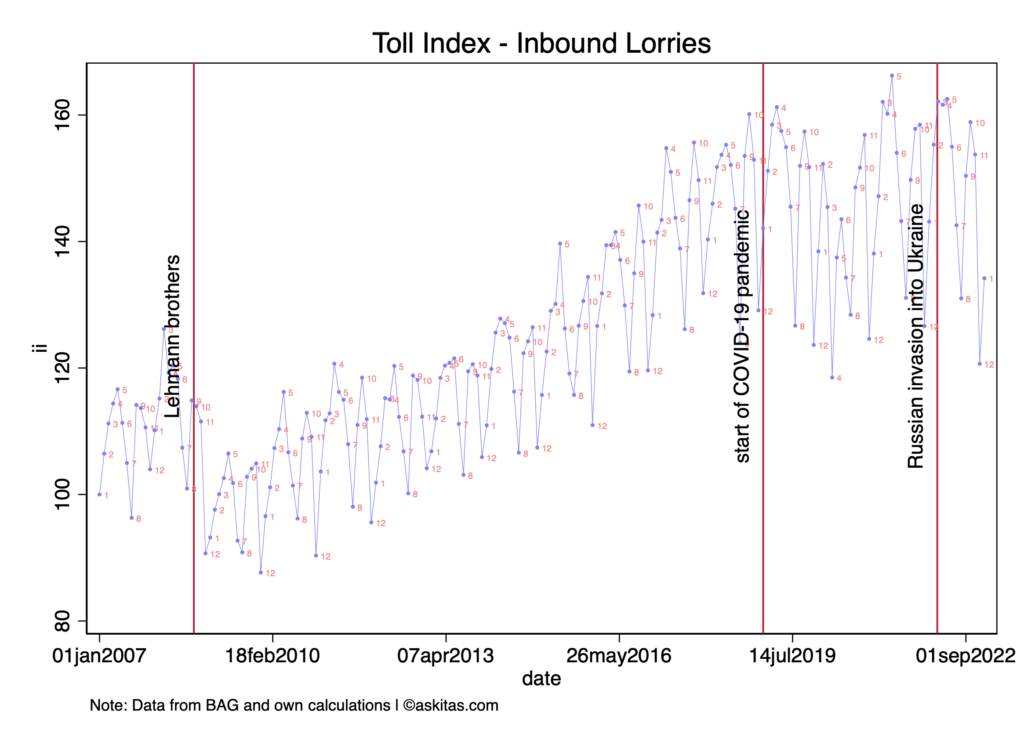
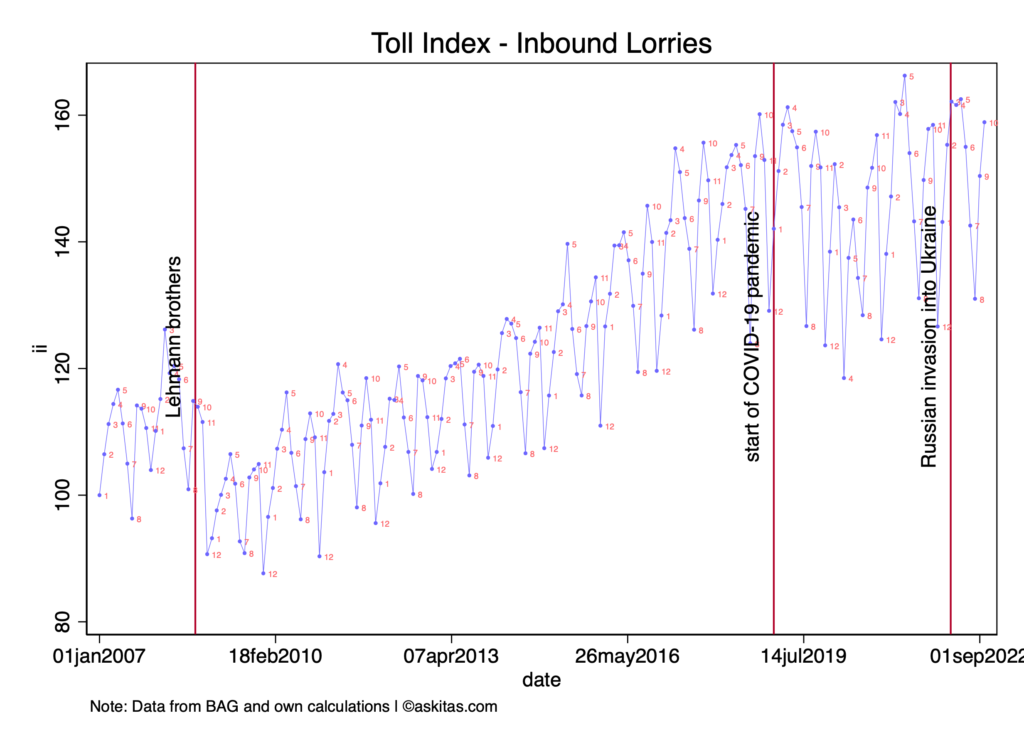
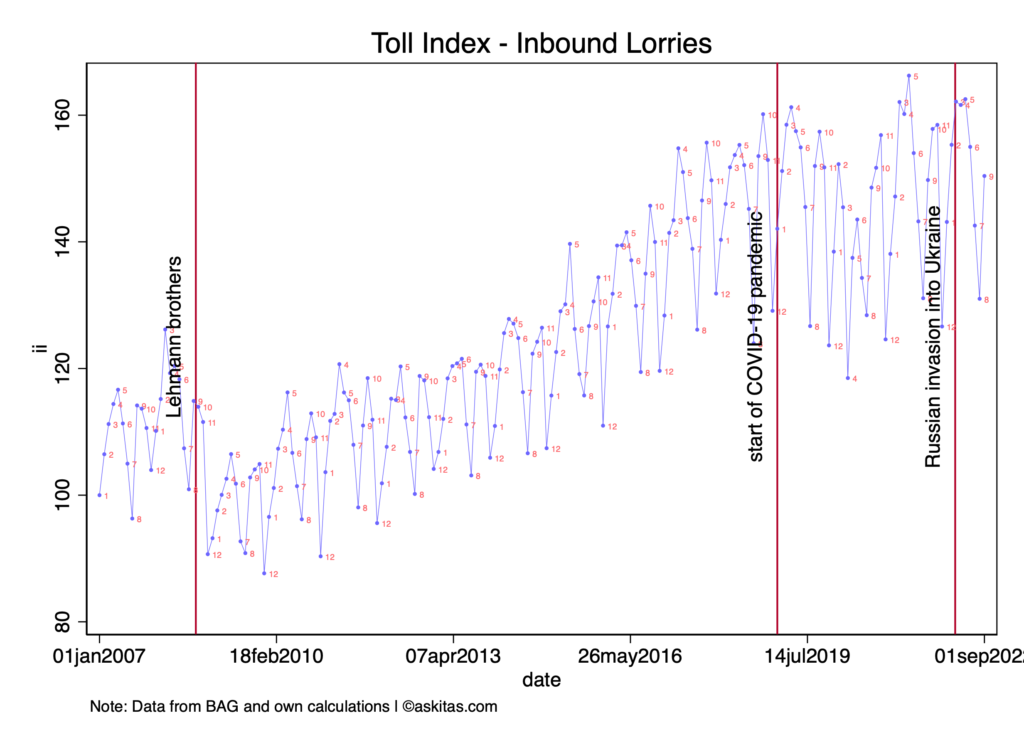
The September value of the Border Crossing Toll Index (just out) adjusted for number of weekdays, time, month and MAUT-policy-regime fixed effects (Figure 1) came at 100.6 continuing an improving trend of several months as can easily be seen in Figure 2 (smoothed). For the newly defined Toll Index see here.
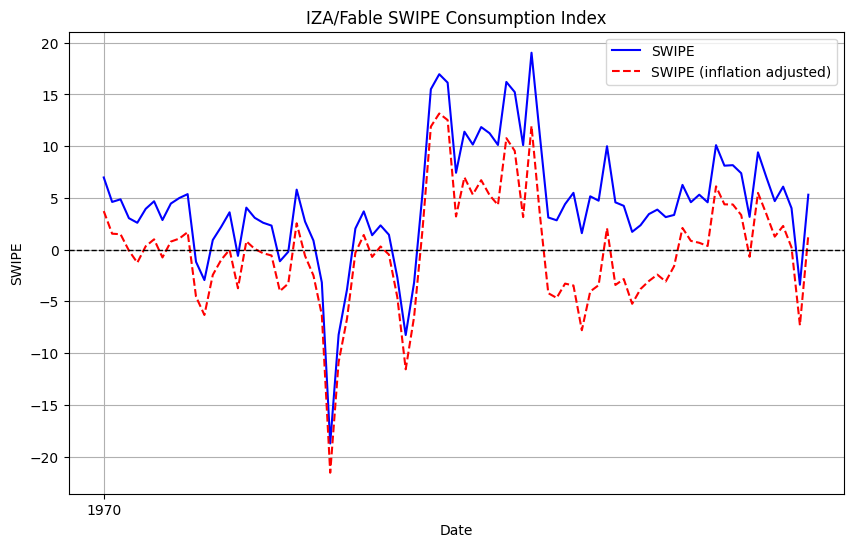
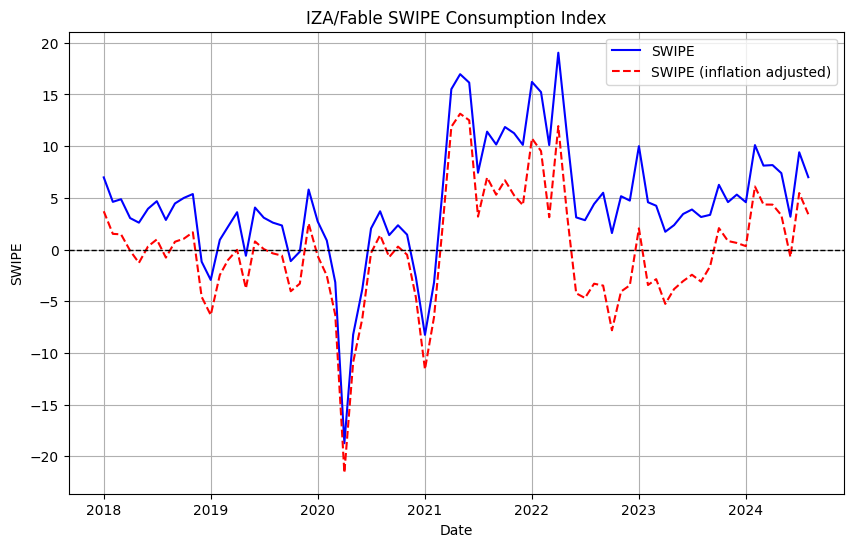
Additionally Figure 3 shows the IZA/Fable SWIPE consumption index (raw in blue and adjusted for inflation in red). While neither goods transportation nor consumption is particularly strong they are both on a clear positive trend indicating that the Fall assessment of the German government which expects a .2% contraction for the year might be overly and unnecessarily pessimistic.
We have just released a new consumption index for Germany just in time as macro-economic conditions are taking center stage again: global supply chain issues, geopolitical turmoil, economic slow-down in much of the world economy (e.g. China stimulus package, USA interest rate cuts, ECB rate cuts, or a mixed German business cycle and a government forecast of contraction in 2024 etc), climate phenomena, right wing populism or lesser but potentially impactful disruptions such as the advent of generative AI.
Final consumption amounts to over 70% of German GDP, whereas household final consumption (more likely to be in our data than, say, government final expenditures) amounts to over 50% of the German GDP. This demonstrates the importance of a consumption indicator for Germany and beyond. Consumption and the Labor Market intermediated by economic growth are interdependent like yin and yang.
Our indicator is informed by daily ingested data. The preliminary value for a given month will be released around the 20th of the month. Incoming data then updates the index daily until it is finalized 2-3 days after the end of the month.
All changes are reflected in the live graph of the index below.
The IZA/Fable Data Consumption Indicator for Germany is based on consumer and small business transactions data from FableData, a leading provider of anonymized, pan-European spending data. It is and IDSC product, introduced in a joint paper of mine with Fable coauthors A.B. Martinez and F.S. Cereda.
The embedded graph above is live in the sense that it is continuously updated in a programmatic manner and it is interactive in the sense that you can zoom in and out of it. Notice also that blue annotations mark important shocks and time regimes useful for understanding the data. In mid-2025 our indicator will cover France and the UK in addition.
If you want to embed it in your website feel free to visit https://fable.radar.iza.org and copy an embed code snippet (top right). We’d be happy to hear how you are using it.
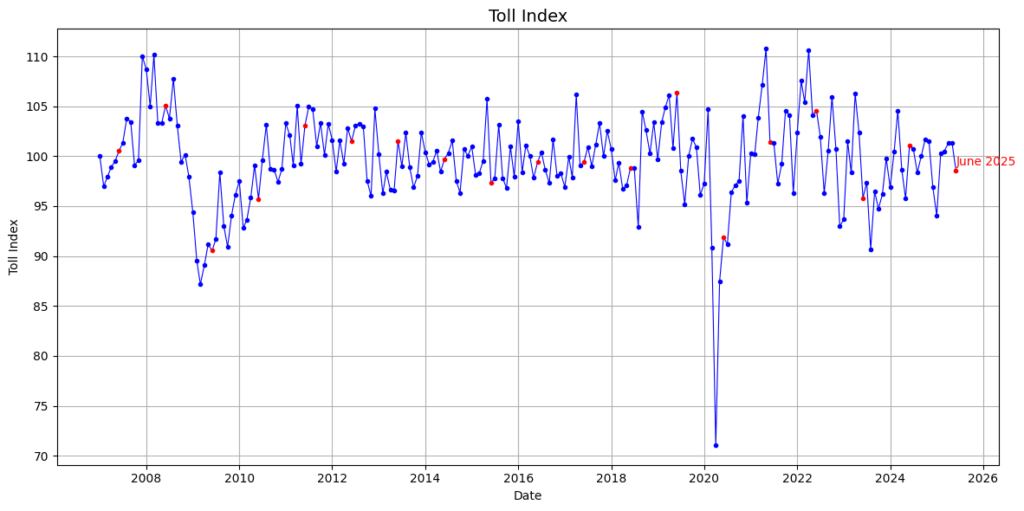
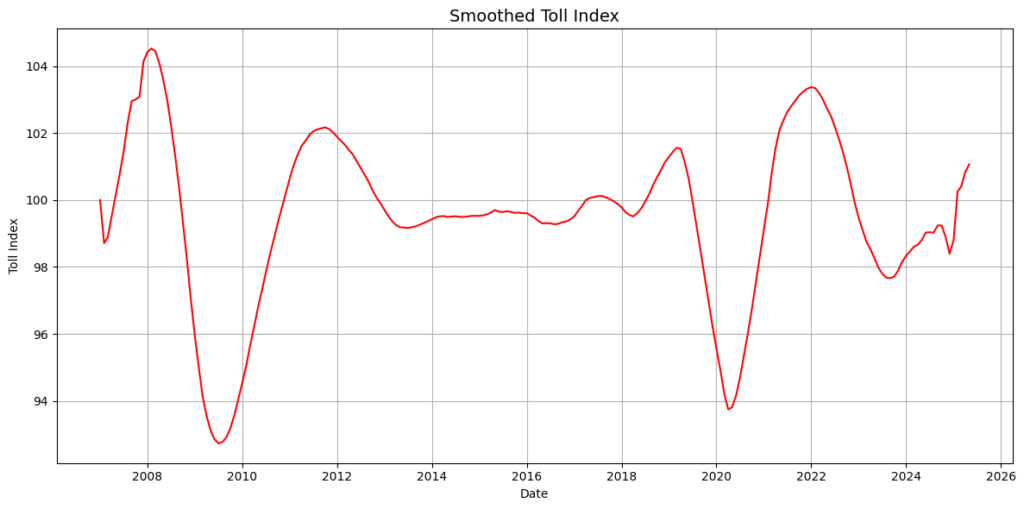
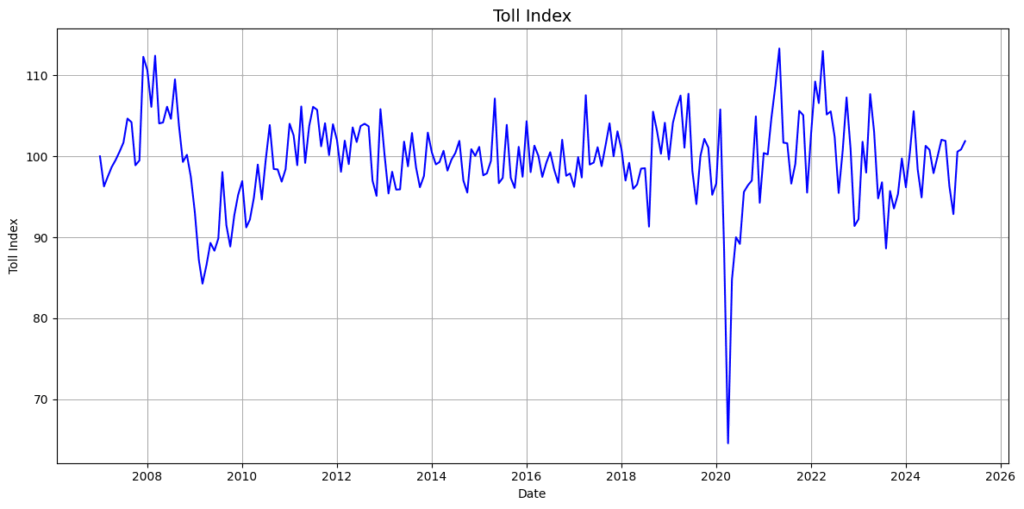
I have been presenting the Toll Index in “raw form” putting off having to do the work to account for structural changes in the MAUT rules (e.g. including trucks of lower tonnage, adding more highways etc). In July of 2024 yet another change took place so I decided to do the econometric work to produce an index without the effect of the various MAUT reforms (see here).
So the newly defined Toll Index is based on border crossing lorries (inbound and outbound) divided by the number of working days in each month. Then we regress the result on:
time
reform dummies
reform dummies interacted with time
month-of-year fixed effects
quarter-of-year fixed effects
Taking the residuals after removing the predicted effects of 2, 3, 4 and 5 above and scaling so that the value is 100 in January of 2007 gives us the Toll Index.
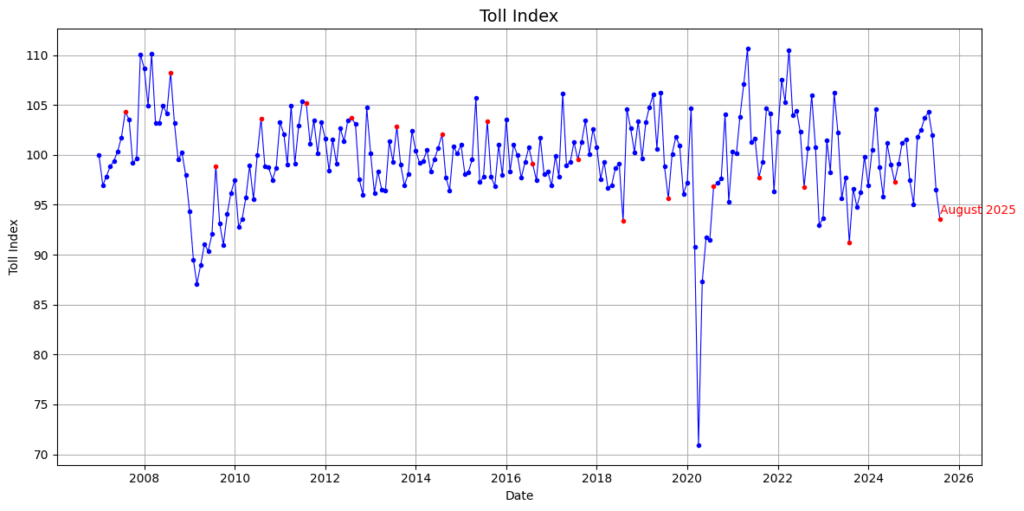
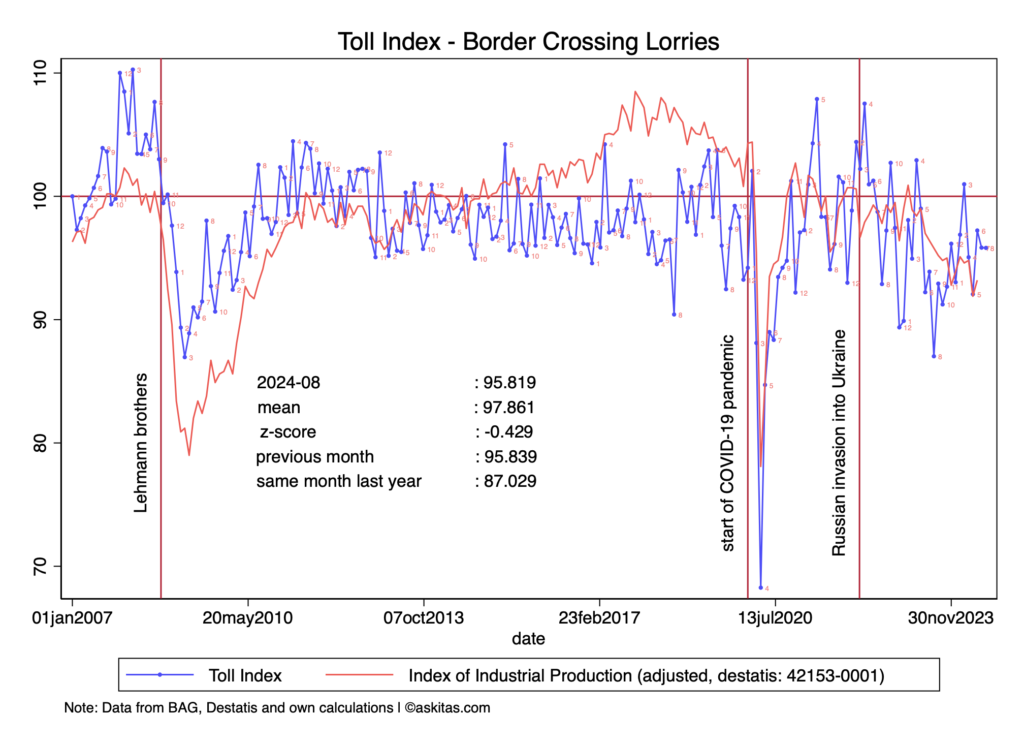
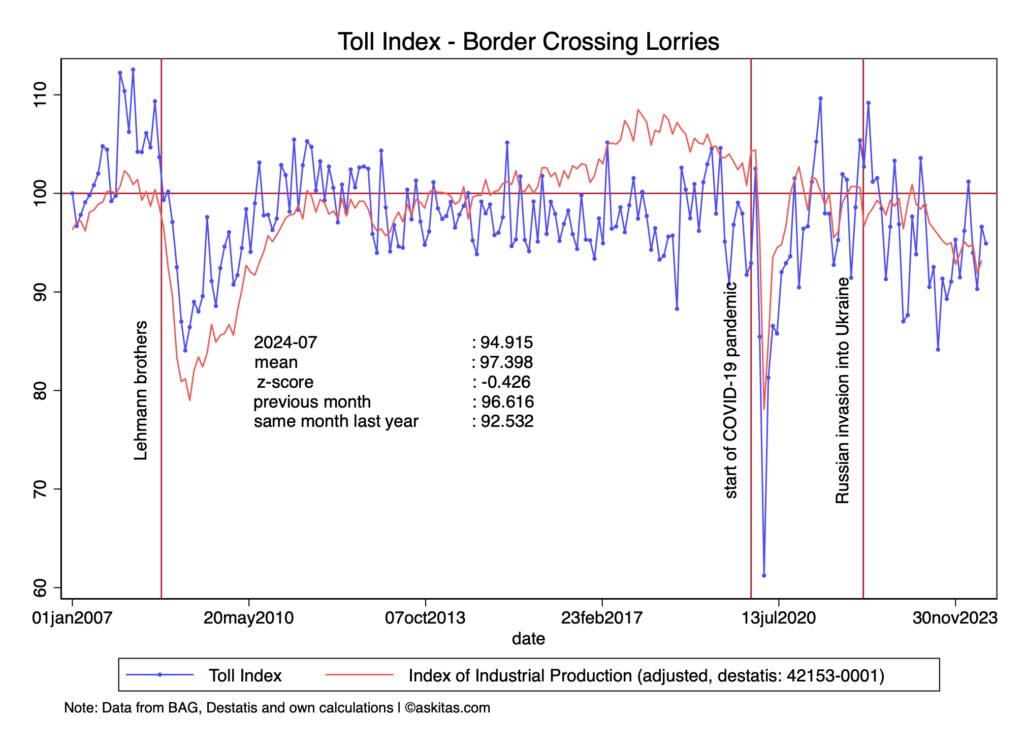
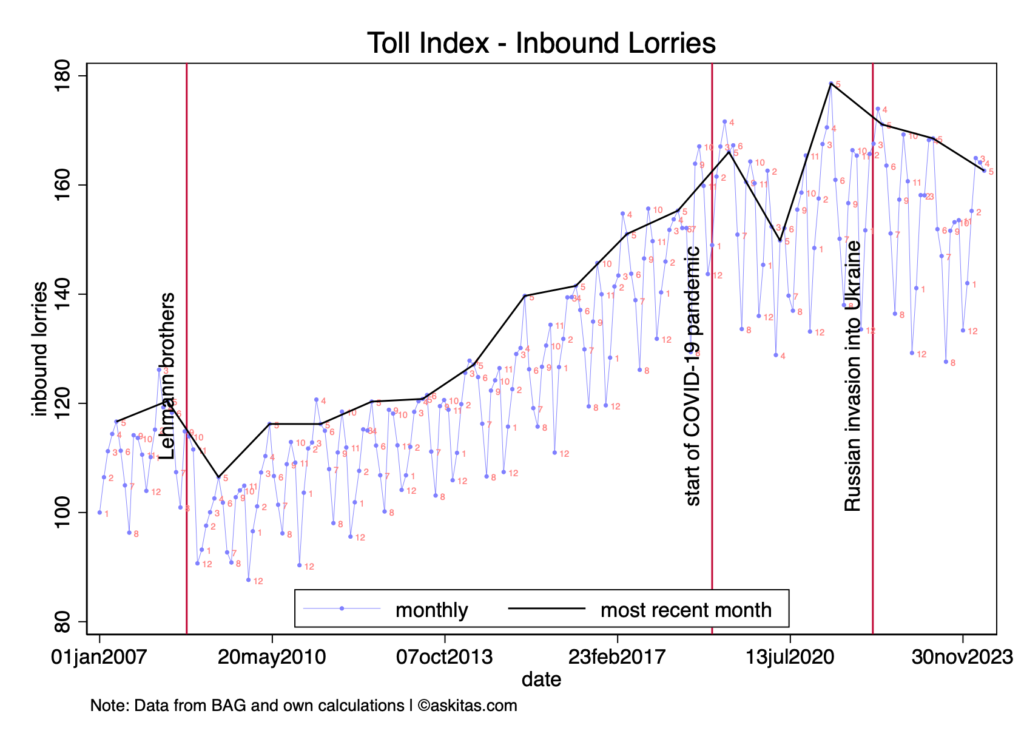
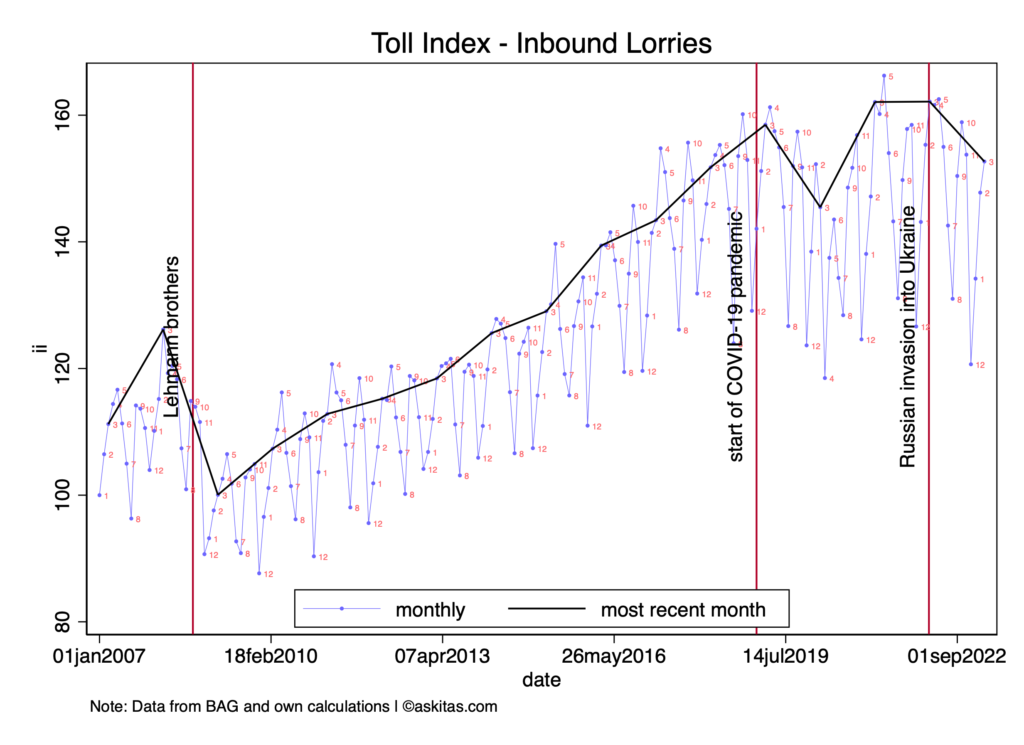
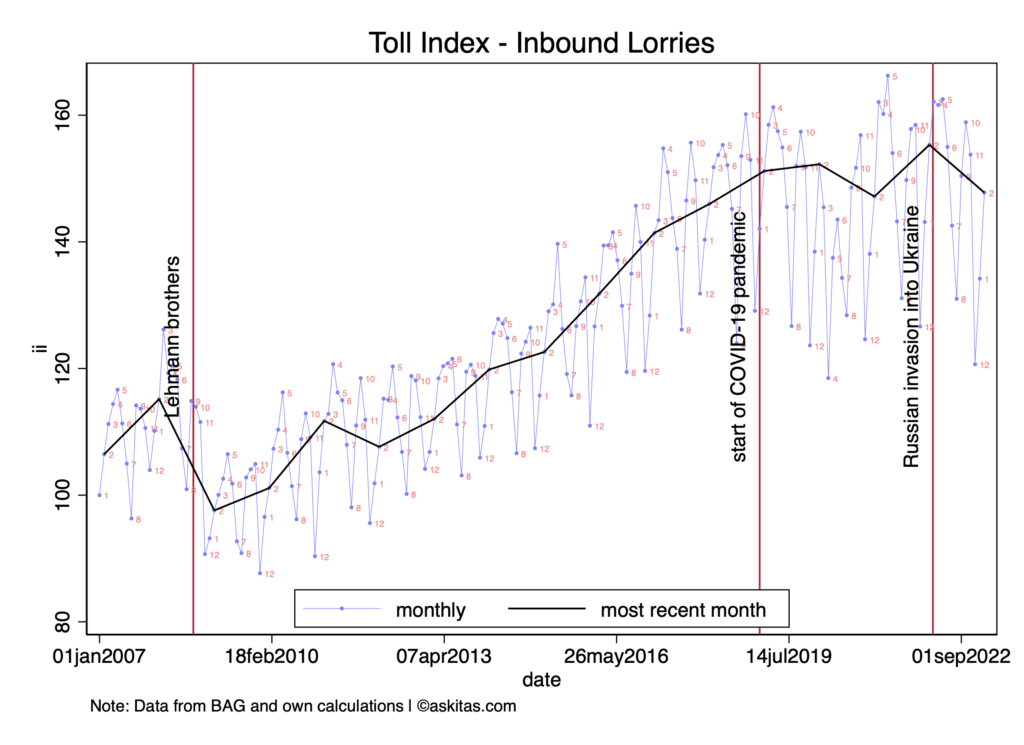
In the figure below we jointly plot the Toll Index and the seasonal and calendar adjusted Index of Industrial Production.
The correlation is visible to the naked eye. In the graph we report this month’s value, the overall mean, the previous month and the same month a year ago. Comparing with the mean tells us how unexpected the new value is (the z-score shows the eccentricity of our current state), comparing with the previous month gives the monthly derivative and comparing with the same month last year gives us the annual derivative. In this chart we are mildly below the mean.
The Toll Index was first proposed in IZA DP5522 which was published in the Journal of Forecasting. It has been widely covered in national and international media (selection):
The German statistical office, in cooperation with the Bundesamt für Güterverkehr, has taken the MAUT data in its portfolio of data products and their efforts can be found here. The Destatis document describing the data is here and here is their publication calendar for 2019.
Citation: “Nowcasting business cycles using toll data.” Journal of Forecasting 32:4 (2013): 299–306(with K. F. Zimmermann).
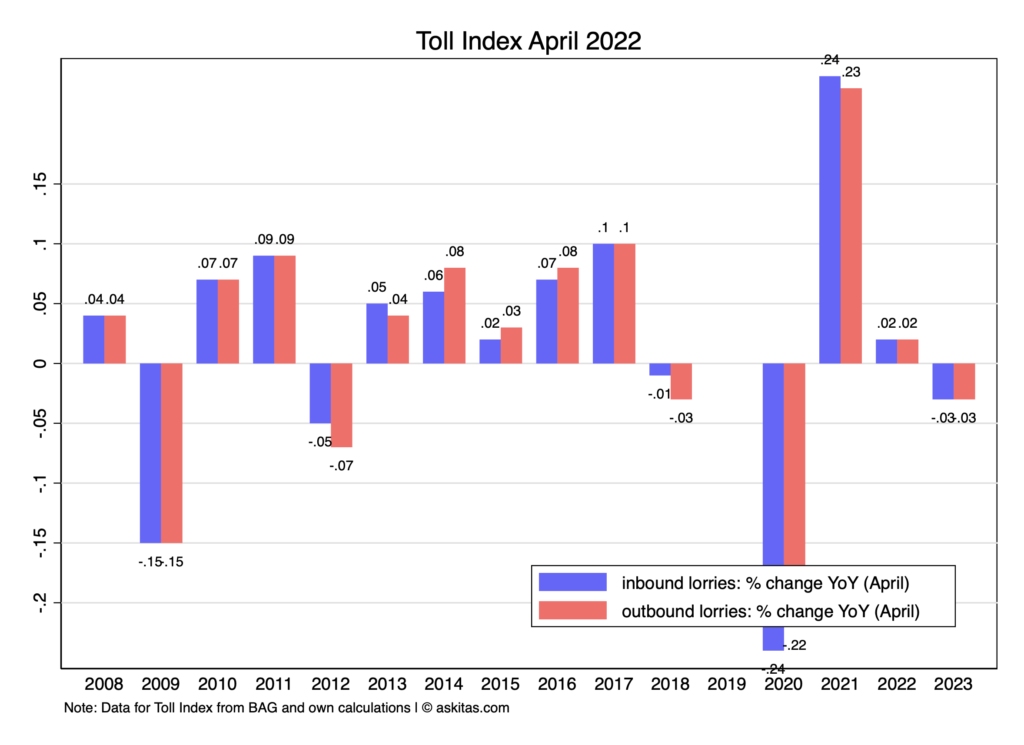
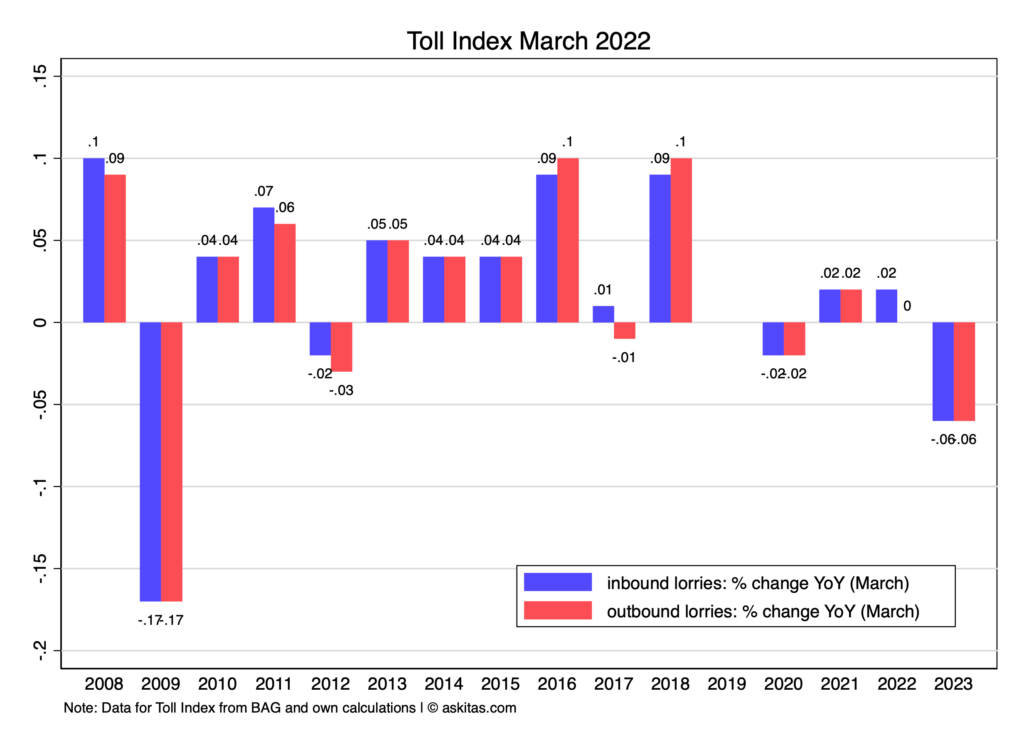
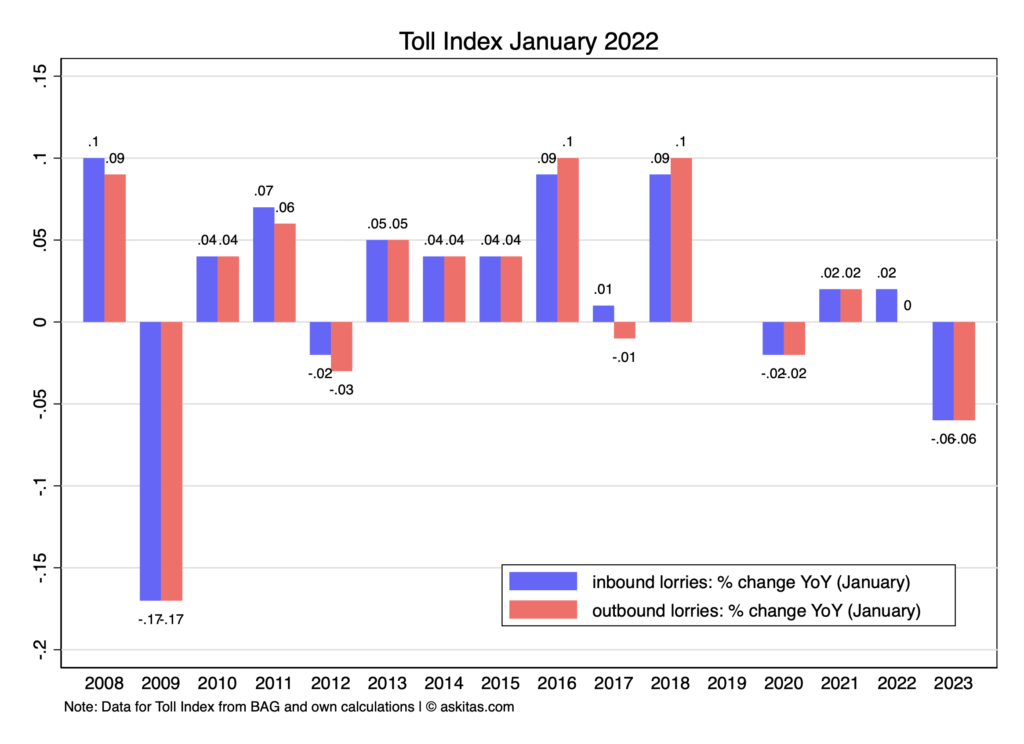
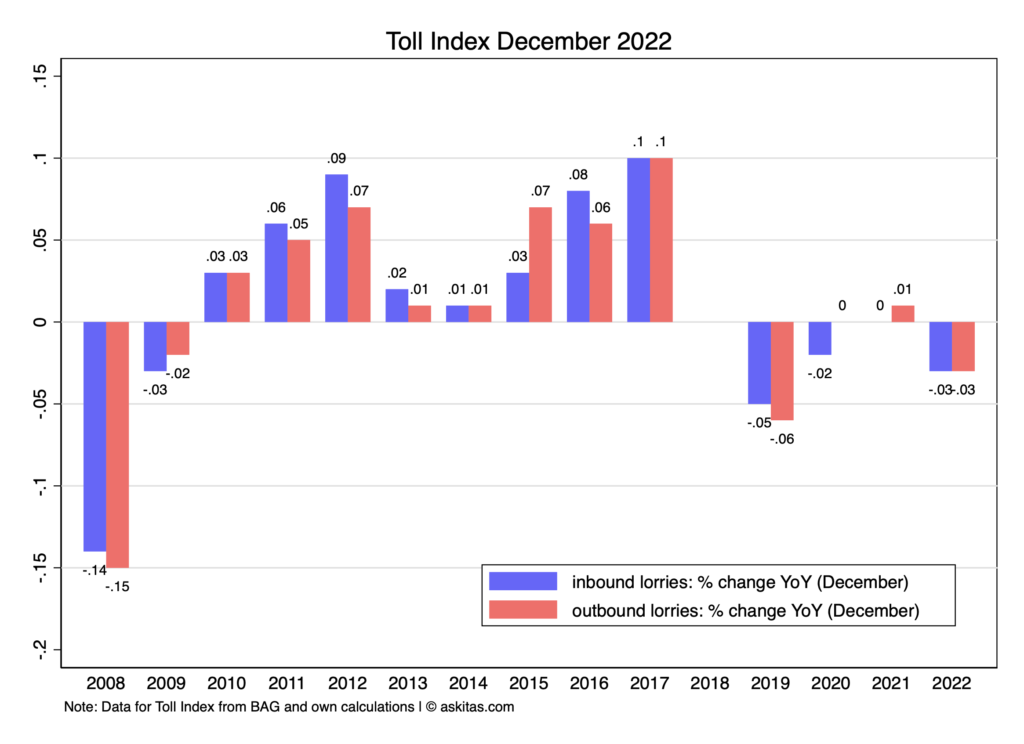
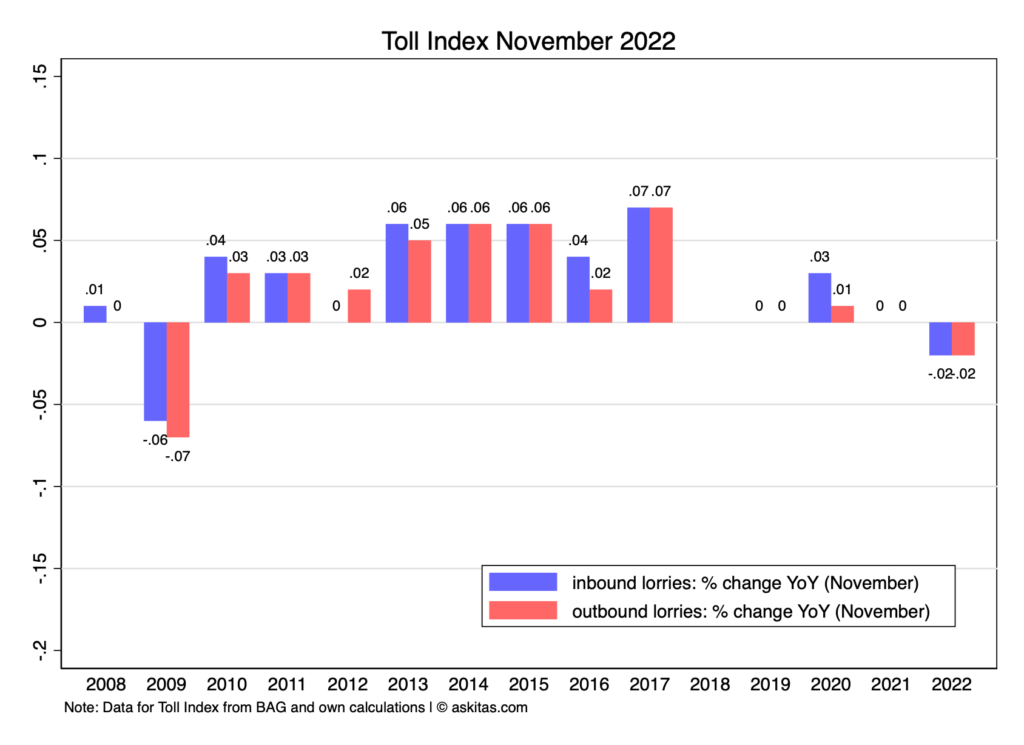
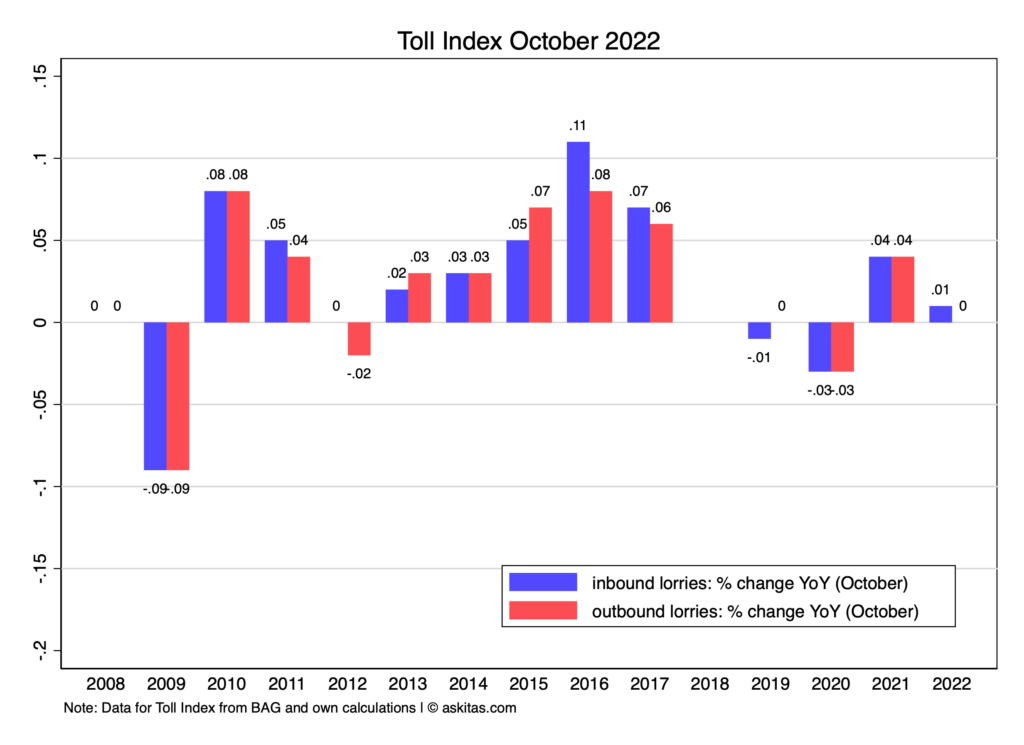
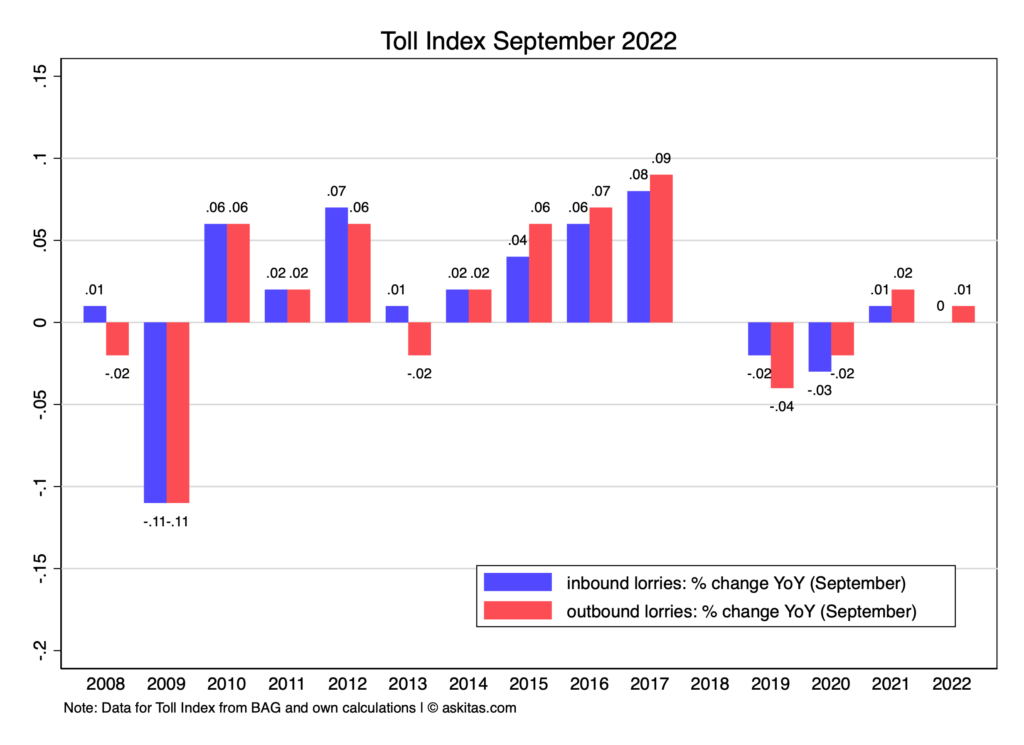
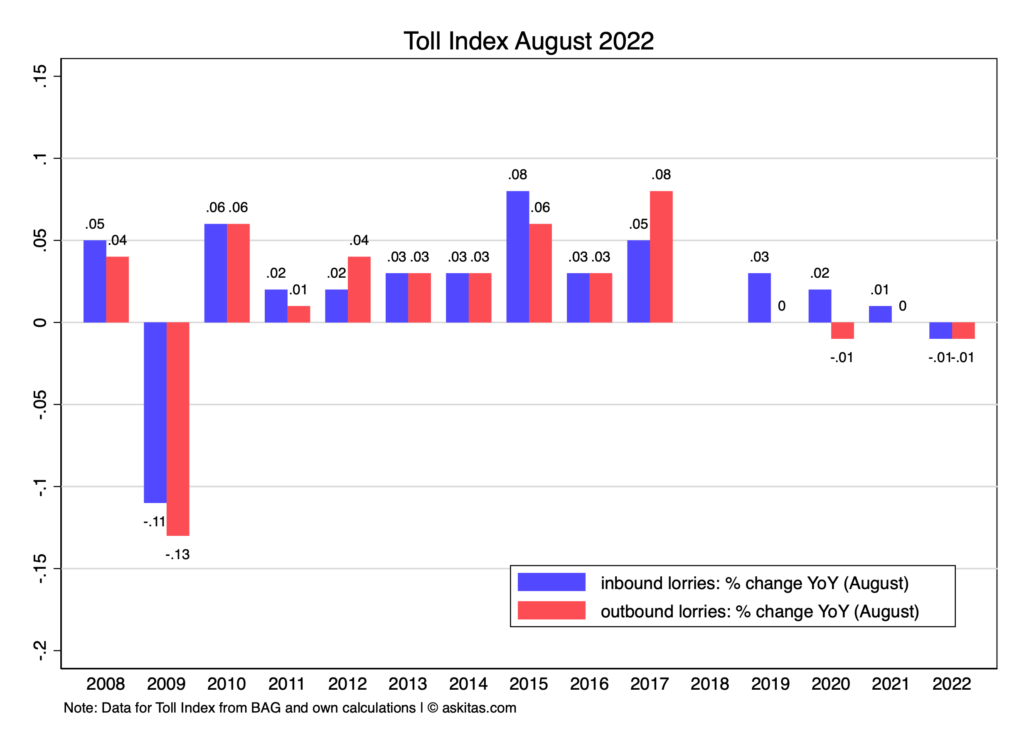
Starting in July 2018 the BAG – Bundesamt für Güterverkehr introduced yet another policy change which affected how lorries pay tolls within the MAUT system as well as the data that come out of this process which are used for computing the Toll Index. The change expanded the network of roads in which toll is due by adding all bundesstraßen to it. While in the long run this is bound to make the Toll Index more accurate this introduced a discontinuity. The BAG even had difficulty producing the numbers timely for about year. After July 2019 we can report year on year changes for each month (with a missing value in 2018 for all months from July to December and a missing value in 2019 for all months from January to June. The Toll Index was first proposed in IZA DP5522 which was published in the Journal of Forecasting. It has been widely covered in national and international media (selection):
The German statistical office, in cooperation with the Bundesamt für Güterverkehr, has taken the MAUT data in its portfolio of data products and their efforts can be found here. The Destatis document describing the data is here and here is their publication calendar for 2019.
Citation: “Nowcasting business cycles using toll data.” Journal of Forecasting 32:4 (2013): 299–306(with K. F. Zimmermann).
Starting in July 2018 the BAG – Bundesamt für Güterverkehr introduced yet another policy change which affected how lorries pay tolls within the MAUT system as well as the data that come out of this process which are used for computing the Toll Index. The change expanded the network of roads in which toll is due by adding all bundesstraßen to it. While in the long run this is bound to make the Toll Index more accurate this introduced a discontinuity. The BAG even had difficulty producing the numbers timely for about year. After July 2019 we can report year on year changes for each month (with a missing value in 2018 for all months from July to December and a missing value in 2019 for all months from January to June. The Toll Index was first proposed in IZA DP5522 which was published in the Journal of Forecasting. It has been widely covered in national and international media (selection): Focus Magazin, Tim Harford – The undercover economist, Financial Times, MoneyWeek, WirtschaftsWoche, CNN International, DRS3 Swiss public radio, Deutsche Welle. The German statistical office, in cooperation with the Bundesamt für Güterverkehr, has taken the MAUT data in its portfolio of data products and their efforts can be found here. The Destatis document describing the data is here and here is their publication calendar for 2019.
Citation: “Nowcasting business cycles using toll data.” Journal of Forecasting 32:4 (2013): 299–306(with K. F. Zimmermann).
At this year’s German Stata Conference (June 15-16, Humboldt University, Berlin) I will be teaching a workshop titled “Stata meets Python”.
What is it about?
Attendants will learn how to use the Python integration facilities that Stata has made available in order to embed Python code in Stata (since version 16) or Stata code in Python (since version 17). Stata calls this integration collectively PyStata. It includes among other ingredients a pystata python package written by Stata (which enables embedding of Stata code in Python) as well as the sfi module – Stata Function Interface (SFI) which can be used to access Stata’s current dataset, frames, macros, scalars, matrices, value lables, global Mata matrices etc.
Why should you attend?
Both languages have large lively communities which create user written programs with little overlap. The integration doubles the amount of ammunition you can throw at data problems.
Starting in July 2018 the BAG – Bundesamt für Güterverkehr introduced yet another policy change which affected how lorries pay tolls within the MAUT system as well as the data that come out of this process which are used for computing the Toll Index. The change expanded the network of roads in which toll is due by adding all bundesstraßen to it. While in the long run this is bound to make the Toll Index more accurate this introduced a discontinuity. The BAG even had difficulty producing the numbers timely for about year. After July 2019 we can report year on year changes for each month (with a missing value in 2018 for all months from July to December and a missing value in 2019 for all months from January to June. The Toll Index was first proposed in IZA DP5522 which was published in the Journal of Forecasting. It has been widely covered in national and international media (selection): Focus Magazin, Tim Harford – The undercover economist, Financial Times, MoneyWeek, WirtschaftsWoche, CNN International, DRS3 Swiss public radio, Deutsche Welle. The German statistical office, in cooperation with the Bundesamt für Güterverkehr, has taken the MAUT data in its portfolio of data products and their efforts can be found here. The Destatis document describing the data is here and here is their publication calendar for 2019.
Citation: “Nowcasting business cycles using toll data.” Journal of Forecasting 32:4 (2013): 299–306(with K. F. Zimmermann).
Starting in July 2018 the BAG – Bundesamt für Güterverkehr introduced yet another policy change which affected how lorries pay tolls within the MAUT system as well as the data that come out of this process which are used for computing the Toll Index. The change expanded the network of roads in which toll is due by adding all bundesstraßen to it. While in the long run this is bound to make the Toll Index more accurate this introduced a discontinuity. The BAG even had difficulty producing the numbers timely for about year. After July 2019 we can report year on year changes for each month (with a missing value in 2018 for all months from July to December and a missing value in 2019 for all months from January to June. The Toll Index was first proposed in IZA DP5522 which was published in the Journal of Forecasting. It has been widely covered in national and international media (selection):
The German statistical office, in cooperation with the Bundesamt für Güterverkehr, has taken the MAUT data in its portfolio of data products and their efforts can be found here. The Destatis document describing the data is here and here is their publication calendar for 2019.
Citation: “Nowcasting business cycles using toll data.” Journal of Forecasting 32:4 (2013): 299–306(with K. F. Zimmermann).
Starting in July 2018 the BAG – Bundesamt für Güterverkehr introduced yet another policy change which affected how lorries pay tolls within the MAUT system as well as the data that come out of this process which are used for computing the Toll Index. The change expanded the network of roads in which toll is due by adding all bundesstraßen to it. While in the long run this is bound to make the Toll Index more accurate this introduced a discontinuity. The BAG even had difficulty producing the numbers timely for about year. After July 2019 we can report year on year changes for each month (with a missing value in 2018 for all months from July to December and a missing value in 2019 for all months from January to June. The Toll Index was first proposed in IZA DP5522 which was published in the Journal of Forecasting. It has been widely covered in national and international media (selection):
Starting in July 2018 the BAG – Bundesamt für Güterverkehr introduced yet another policy change which affected how lorries pay tolls within the MAUT system as well as the data that come out of this process which are used for computing the Toll Index. The change expanded the network of roads in which toll is due by adding all bundesstraßen to it. While in the long run this is bound to make the Toll Index more accurate this introduced a discontinuity. The BAG even had difficulty producing the numbers timely for about year. After July 2019 we can report year on year changes for each month (with a missing value in 2018 for all months from July to December and a missing value in 2019 for all months from January to June. The Toll Index was first proposed in IZA DP5522 which was published in the Journal of Forecasting. It has been widely covered in national and international media (selection):
Starting in July 2018 the BAG – Bundesamt für Güterverkehr introduced yet another policy change which affected how lorries pay tolls within the MAUT system as well as the data that come out of this process which are used for computing the Toll Index. The change expanded the network of roads in which toll is due by adding all bundesstraßen to it. While in the long run this is bound to make the Toll Index more accurate this introduced a discontinuity. The BAG even had difficulty producing the numbers timely for about year. After July 2019 we can report year on year changes for each month (with a missing value in 2018 for all months from July to December and a missing value in 2019 for all months from January to June. The Toll Index was first proposed in IZA DP5522 which was published in the Journal of Forecasting. It has been widely covered in national and international media (selection):
Starting in July 2018 the BAG – Bundesamt für Güterverkehr introduced yet another policy change which affected how lorries pay tolls within the MAUT system as well as the data that come out of this process which are used for computing the Toll Index. The change expanded the network of roads in which toll is due by adding all bundesstraßen to it. While in the long run this is bound to make the Toll Index more accurate this introduced a discontinuity. The BAG even had difficulty producing the numbers timely for about year. After July 2019 we can report year on year changes for each month (with a missing value in 2018 for all months from July to December and a missing value in 2019 for all months from January to June. The Toll Index was first proposed in IZA DP5522 which was published in the Journal of Forecasting. It has been widely covered in national and international media (selection):
Starting in July 2018 the BAG – Bundesamt für Güterverkehr introduced yet another policy change which affected how lorries pay tolls within the MAUT system as well as the data that come out of this process which are used for computing the Toll Index. The change expanded the network of roads in which toll is due by adding all bundesstraßen to it. While in the long run this is bound to make the Toll Index more accurate this introduced a discontinuity. The BAG even had difficulty producing the numbers timely for about year. After July 2019 we can report year on year changes for each month (with a missing value in 2018 for all months from July to December and a missing value in 2019 for all months from January to June. The Toll Index was first proposed in IZA DP5522 which was published in the Journal of Forecasting. It has been widely covered in national and international media (selection):
Starting in July 2018 the BAG – Bundesamt für Güterverkehr introduced yet another policy change which affected how lorries pay tolls within the MAUT system as well as the data that come out of this process which are used for computing the Toll Index. The change expanded the network of roads in which toll is due by adding all bundesstraßen to it. While in the long run this is bound to make the Toll Index more accurate this introduced a discontinuity. The BAG even had difficulty producing the numbers timely for about year. After July 2019 we can report year on year changes for each month (with a missing value in 2018 for all months from July to December and a missing value in 2019 for all months from January to June. The Toll Index was first proposed in IZA DP5522 which was published in the Journal of Forecasting. It has been widely covered in national and international media (selection):
Starting in July 2018 the BAG – Bundesamt für Güterverkehr introduced yet another policy change which affected how lorries pay tolls within the MAUT system as well as the data that come out of this process which are used for computing the Toll Index. The change expanded the network of roads in which toll is due by adding all bundesstraßen to it. While in the long run this is bound to make the Toll Index more accurate this introduced a discontinuity. The BAG even had difficulty producing the numbers timely for about year. After July 2019 we can report year on year changes for each month (with a missing value in 2018 for all months from July to December and a missing value in 2019 for all months from January to June. The Toll Index was first proposed in IZA DP5522 which was published in the Journal of Forecasting. It has been widely covered in national and international media (selection):
The German statistical office, in cooperation with the Bundesamt für Güterverkehr, has taken the MAUT data in its portfolio of data products and their efforts can be found here. The Destatis document describing the data is here and here is their publication calendar for 2019. Citation: “Nowcasting business cycles using toll data.” Journal of Forecasting 32:4 (2013): 299–306(with K. F. Zimmermann).
Citation: “Nowcasting business cycles using toll data.” Journal of Forecasting 32:4 (2013): 299–306(with K. F. Zimmermann).
Starting in July 2018 the BAG – Bundesamt für Güterverkehr introduced yet another policy change which affected how lorries pay tolls within the MAUT system as well as the data that come out of this process which are used for computing the Toll Index. The change expanded the network of roads in which toll is due by adding all bundesstraßen to it. While in the long run this is bound to make the Toll Index more accurate this introduced a discontinuity. The BAG even had difficulty producing the numbers timely for about year. After July 2019 we can report year on year changes for each month (with a missing value in 2018 for all months from July to December and a missing value in 2019 for all months from January to June. The Toll Index was first proposed in IZA DP5522 which was published in the Journal of Forecasting. It has been widely covered in national and international media (selection): Focus Magazin, Tim Harford – The undercover economist, Financial Times, MoneyWeek, WirtschaftsWoche, CNN International, DRS3 Swiss public radio, Deutsche Welle.
The German statistical office, in cooperation with the Bundesamt für Güterverkehr, has taken the MAUT data in its portfolio of data products and their efforts can be found here. The Destatis document describing the data is here and here is their publication calendar for 2019. Citation: “Nowcasting business cycles using toll data.” Journal of Forecasting 32:4 (2013): 299–306(with K. F. Zimmermann).
Citation: “Nowcasting business cycles using toll data.” Journal of Forecasting 32:4 (2013): 299–306(with K. F. Zimmermann).
Our paper (joined with K. Tatsiramos and B. Verheyden) on Estimating worldwide effects of non-pharmaceutical interventions on COVID-19 incidence and population mobility patterns using a multiple-event study published in Nature Journal: Scientific Reports.
Image Providers(s): CDC/ Alissa Eckert, MSMI; Dan Higgins, MAMS
Citation:
Askitas, N., Tatsiramos, K. & Verheyden, B. Estimating worldwide effects of non-pharmaceutical interventions on COVID-19 incidence and population mobility patterns using a multiple-event study. Sci Rep11, 1972 (2021). https://doi.org/10.1038/s41598-021-81442-x