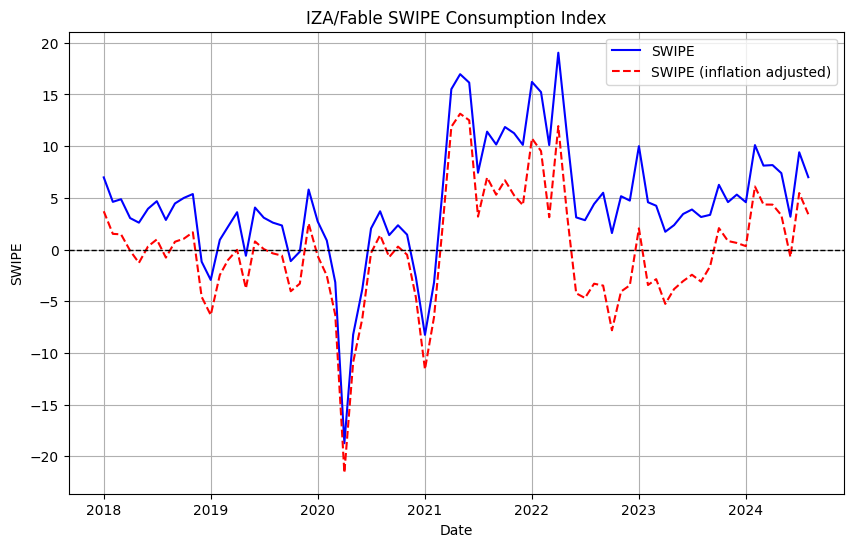
We have just released a new consumption index for Germany just in time as macro-economic conditions are taking center stage again: global supply chain issues, geopolitical turmoil, economic slow-down in much of the world economy (e.g. China stimulus package, USA interest rate cuts, ECB rate cuts, or a mixed German business cycle and a government forecast of contraction in 2024 etc), climate phenomena, right wing populism or lesser but potentially impactful disruptions such as the advent of generative AI.
Final consumption amounts to over 70% of German GDP, whereas household final consumption (more likely to be in our data than, say, government final expenditures) amounts to over 50% of the German GDP. This demonstrates the importance of a consumption indicator for Germany and beyond. Consumption and the Labor Market intermediated by economic growth are interdependent like yin and yang.
Our indicator is informed by daily ingested data. The preliminary value for a given month will be released around the 20th of the month. Incoming data then updates the index daily until it is finalized 2-3 days after the end of the month.
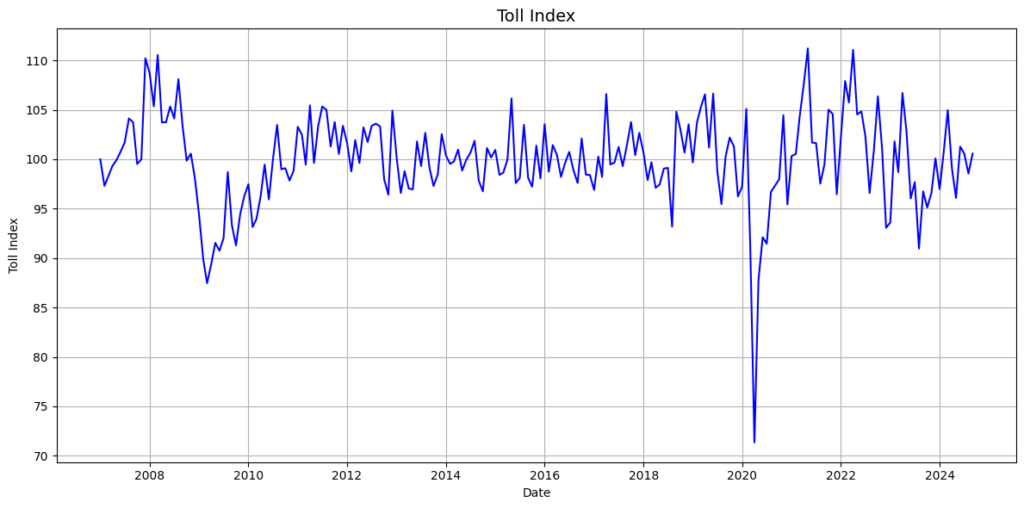
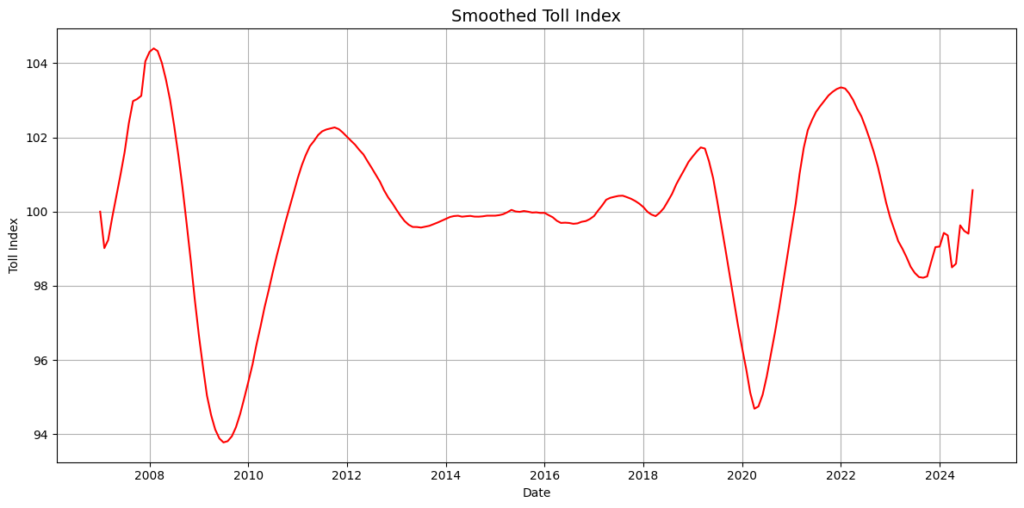
All changes are reflected in the live graph of the index below.
The IZA/Fable Data Consumption Indicator for Germany is based on consumer and small business transactions data from FableData, a leading provider of anonymized, pan-European spending data. It is and IDSC product, introduced in a joint paper of mine with Fable coauthors A.B. Martinez and F.S. Cereda.
The embedded graph above is live in the sense that it is continuously updated in a programmatic manner and it is interactive in the sense that you can zoom in and out of it. Notice also that blue annotations mark important shocks and time regimes useful for understanding the data. In mid-2025 our indicator will cover France and the UK in addition.
If you want to embed it in your website feel free to visit https://fable.radar.iza.org and copy an embed code snippet (top right). We’d be happy to hear how you are using it.
Paper: The IZA/Fable Swipe Consumption Index