Our paper (joined with K. Tatsiramos and B. Verheyden) on Estimating worldwide effects of non-pharmaceutical interventions on COVID-19 incidence and population mobility patterns using a multiple-event study published in Nature Journal: Scientific Reports.
Image Providers(s): CDC/ Alissa Eckert, MSMI; Dan Higgins, MAMS
Citation:
Askitas, N., Tatsiramos, K. & Verheyden, B. Estimating worldwide effects of non-pharmaceutical interventions on COVID-19 incidence and population mobility patterns using a multiple-event study. Sci Rep11, 1972 (2021). https://doi.org/10.1038/s41598-021-81442-x
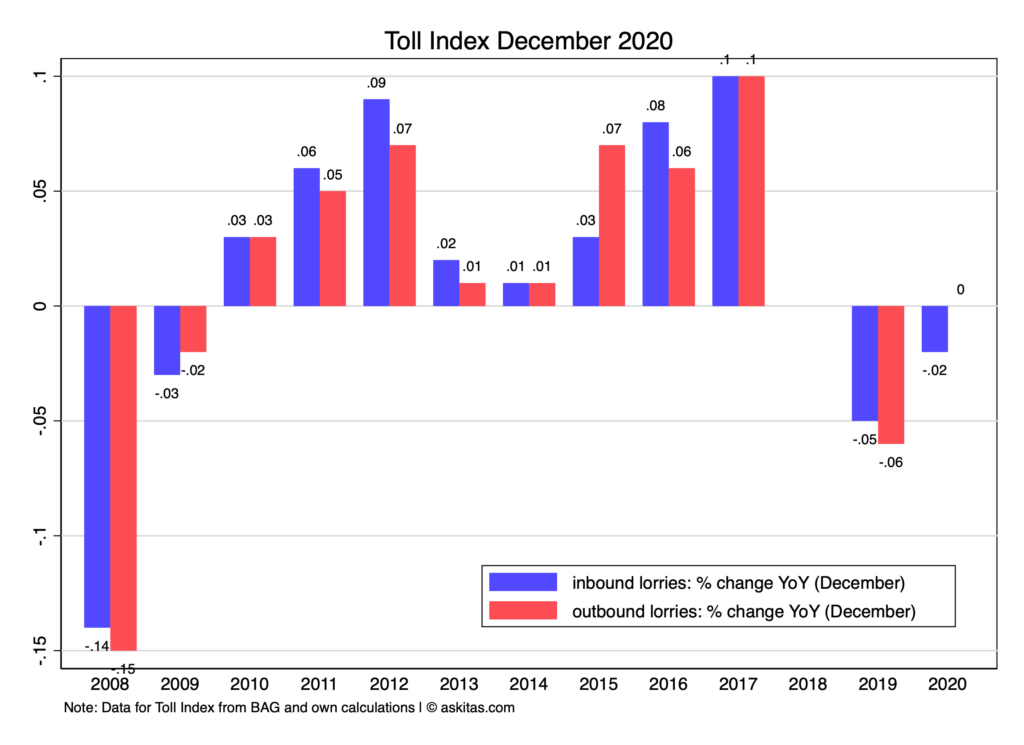
Starting in July 2018 the BAG – Bundesamt für Güterverkehr introduced yet another policy change which affected how lorries pay tolls within the MAUT system as well as the data that come out of this process which are used for computing the Toll Index. The change expanded the network of roads in which toll is due by adding all bundesstraßen to it.
While in the long run this is bound to make the Toll Index more accurate this introduced a discontinuity. The BAG even had difficulty producing the numbers timely for about year. After July 2019 we can report year on year changes for each month (with a missing value in 2018 for all months from July to December and a missing value in 2019 for all months from January to June.
The TollIndex was first proposed in IZA DP5522 which was published in the Journal of Forecasting. It has been widely covered in national and international media (selection):
The German statistical office, in cooperation with the Bundesamt für Güterverkehr, has taken the MAUT data in its portfolio of data products and their efforts can be found here. The Destatis document describing the data is here and here is their publication calendar for 2019.
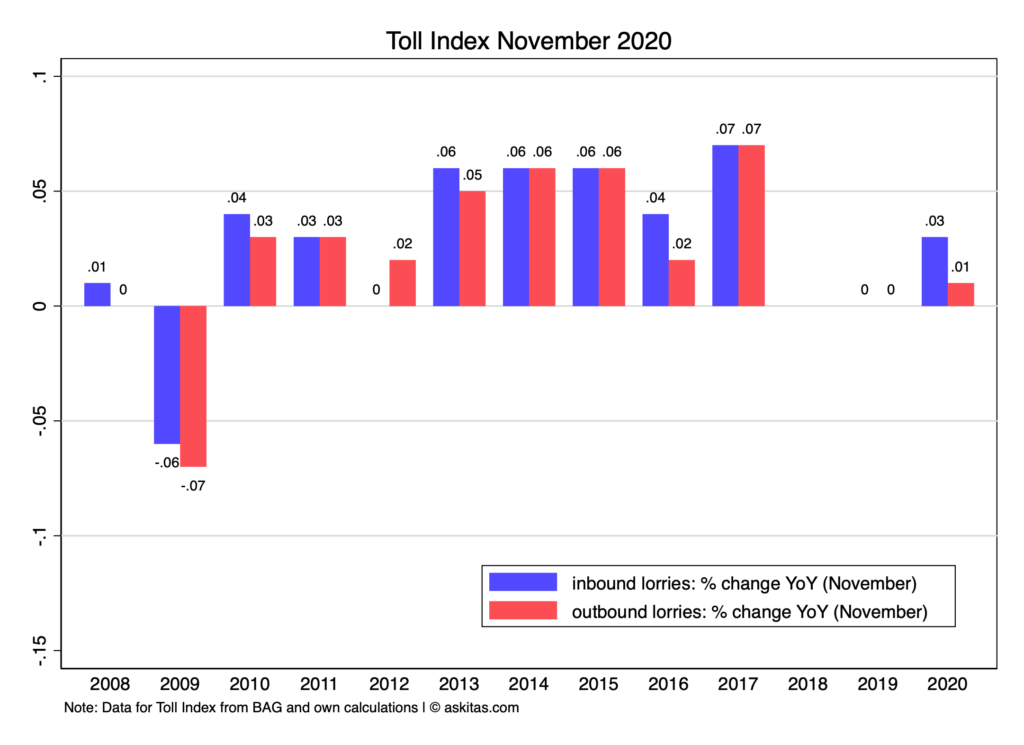
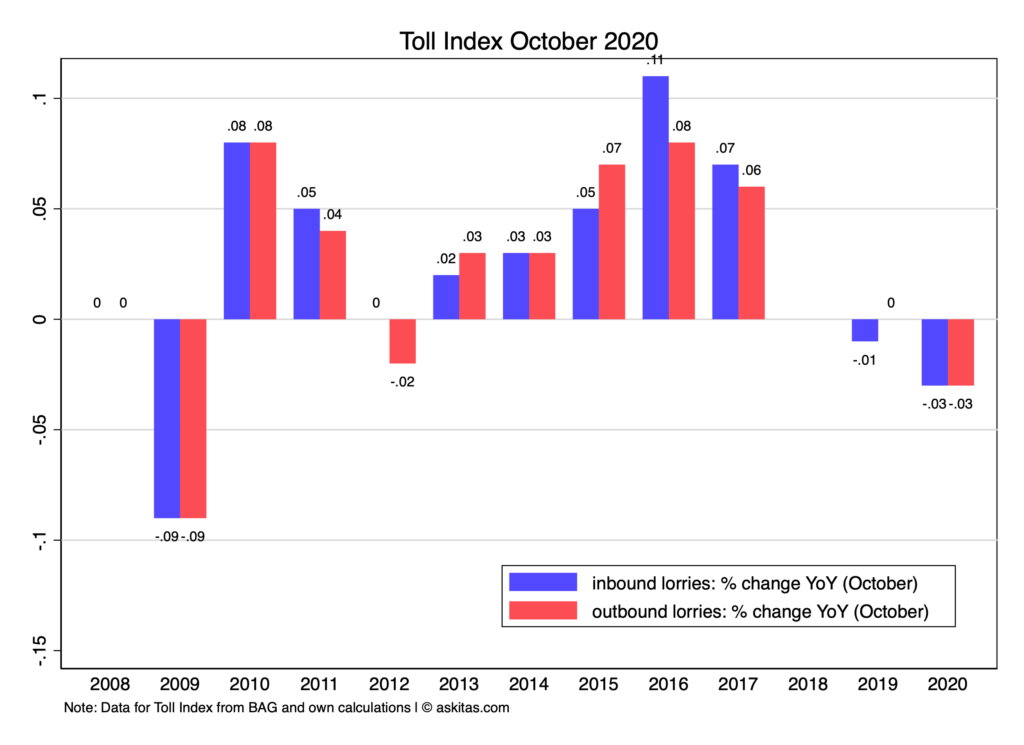
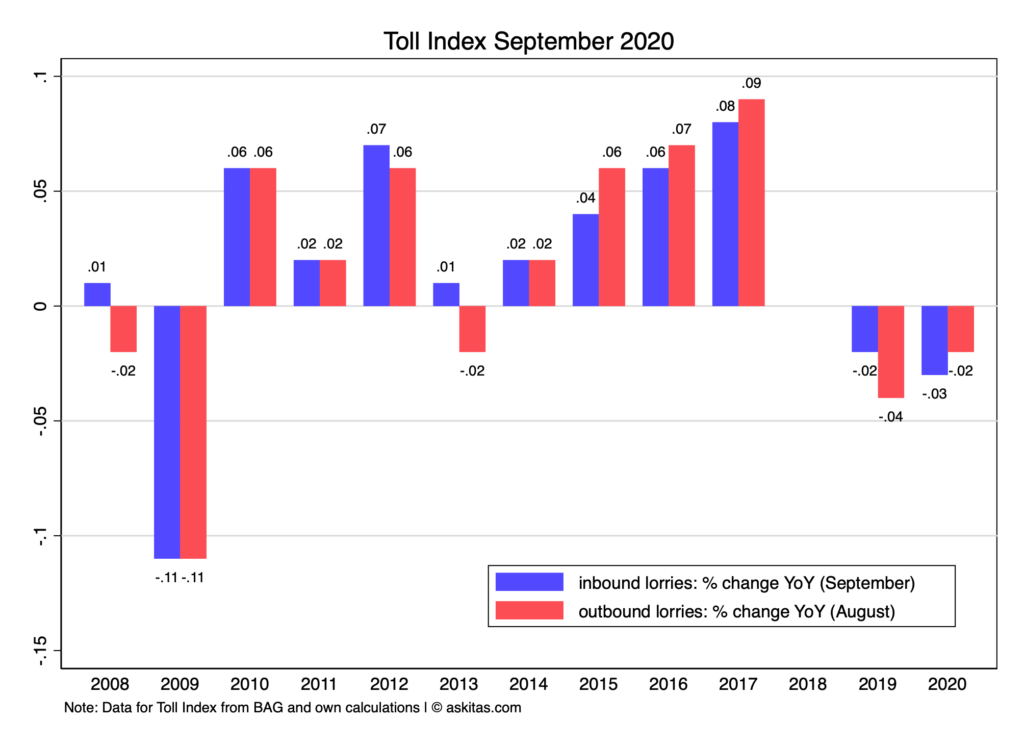
Starting in July 2018 the BAG – Bundesamt für Güterverkehr introduced yet another policy change which affected how lorries pay tolls within the MAUT system as well as the data that come out of this process which are used for computing the Toll Index. The change expanded the network of roads in which toll is due by adding all bundesstraßen to it.
While in the long run this is bound to make the Toll Index more accurate in these past twelve months it made it useless for nowcasting. Moreover the BAG had difficulty producing the numbers timely for about year. After July 2019 we can report year on year changes for each month (with a missing value in 2018 for all months from July to December and a missing value in 2019 for all months from January to June.
The TollIndex was first proposed in IZA DP5522 which was published in the Journal of Forecasting. It has been widely covered in national and international media (selection):
The German statistical office, in cooperation with the Bundesamt für Güterverkehr, has taken the MAUT data in its portfolio of data products and their efforts can be found here. The Destatis document describing the data is here and here is their publication calendar for 2019.