Toll Index September 2024

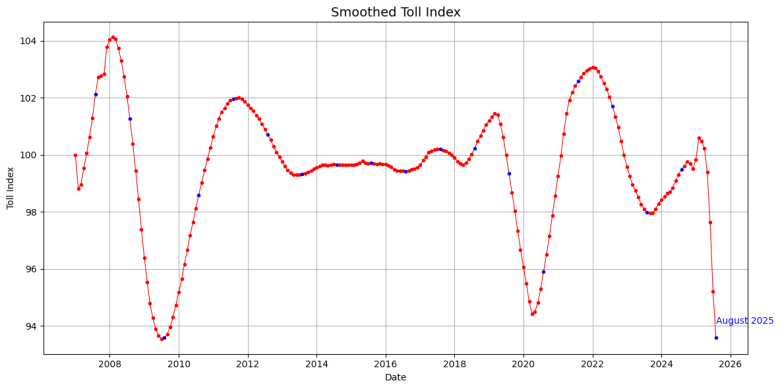
The September value of the Border Crossing Toll Index (just out) adjusted for number of weekdays, time, month and MAUT-policy-regime fixed effects (Figure 1) came at 100.6 continuing an improving trend of several months as can easily be seen in Figure 2 (smoothed). For the newly defined Toll Index see here.

Additionally Figure 3 shows the IZA/Fable SWIPE consumption index (raw in blue and adjusted for inflation in red). While neither goods transportation nor consumption is particularly strong they are both on a clear positive trend indicating that the Fall assessment of the German government which expects a .2% contraction for the year might be overly and unnecessarily pessimistic.

Figure 1

Figure 2

Figure 3

Toll Index July 2024 – new definition

I have been presenting the Toll Index in “raw form” putting off having to do the work to account for structural changes in the MAUT rules (e.g. including trucks of lower tonnage, adding more highways etc). In July of 2024 yet another change took place so I decided to do the econometric work to produce an index without the effect of the various MAUT reforms (see here).

So the newly defined Toll Index is based on border crossing lorries (inbound and outbound) divided by the number of working days in each month. Then we regress the result on:

  1. time
  2. reform dummies
  3. reform dummies interacted with time
  4. month-of-year fixed effects
  5. quarter-of-year fixed effects

Taking the residuals after removing the predicted effects of 2, 3, 4 and 5 above and scaling so that the value is 100 in January of 2007 gives us the Toll Index.

In the figure below we jointly plot the Toll Index and the seasonal and calendar adjusted Index of Industrial Production.

The correlation is visible to the naked eye. In the graph we report this month’s value, the overall mean, the previous month and the same month a year ago. Comparing with the mean tells us how unexpected the new value is (the z-score shows the eccentricity of our current state), comparing with the previous month gives the monthly derivative and comparing with the same month last year gives us the annual derivative. In this chart we are mildly below the mean.

The Toll Index was first proposed in IZA DP5522 which was published in the Journal of Forecasting. It has been widely covered in national and international media (selection):


Focus Magazin,
Tim Harford – The undercover economist,
Financial Times,
MoneyWeek,
WirtschaftsWoche,
CNN International,
DRS3 Swiss public radio,
Deutsche Welle.

The German statistical office, in cooperation with the Bundesamt für Güterverkehr,  has taken the MAUT data in its portfolio of data products and their efforts can be found here. The Destatis document describing the data is here and here is their publication calendar for 2019.

Citation: “Nowcasting business cycles using toll data.” Journal of Forecasting 32:4 (2013): 299–306(with K. F. Zimmermann).

Toll Index June 2024

Starting in July 2018 the BAG – Bundesamt für Güterverkehr introduced yet another policy change which affected how lorries pay tolls within the MAUT system as well as the data that come out of this process which are used for computing the Toll Index. The change expanded the network of roads in which toll is due by adding all bundesstraßen to it.
While in the long run this is bound to make the Toll Index more accurate this introduced a discontinuity. The BAG even had difficulty producing the numbers timely for about year. After July 2019 we can report year on year changes for each month (with a missing value in 2018 for all months from July to December and a missing value in 2019 for all months from January to June.
The Toll Index was first proposed in IZA DP5522 which was published in the Journal of Forecasting. It has been widely covered in national and international media (selection):


Focus Magazin,
Tim Harford – The undercover economist,
Financial Times,
MoneyWeek,
WirtschaftsWoche,
CNN International,
DRS3 Swiss public radio,
Deutsche Welle.

The German statistical office, in cooperation with the Bundesamt für Güterverkehr,  has taken the MAUT data in its portfolio of data products and their efforts can be found here. The Destatis document describing the data is here and here is their publication calendar for 2019.

Citation: “Nowcasting business cycles using toll data.” Journal of Forecasting 32:4 (2013): 299–306(with K. F. Zimmermann).

Toll Index May 2024

Starting in July 2018 the BAG – Bundesamt für Güterverkehr introduced yet another policy change which affected how lorries pay tolls within the MAUT system as well as the data that come out of this process which are used for computing the Toll Index. The change expanded the network of roads in which toll is due by adding all bundesstraßen to it.
While in the long run this is bound to make the Toll Index more accurate this introduced a discontinuity. The BAG even had difficulty producing the numbers timely for about year. After July 2019 we can report year on year changes for each month (with a missing value in 2018 for all months from July to December and a missing value in 2019 for all months from January to June.
The Toll Index was first proposed in IZA DP5522 which was published in the Journal of Forecasting. It has been widely covered in national and international media (selection):


Focus Magazin,
Tim Harford – The undercover economist,
Financial Times,
MoneyWeek,
WirtschaftsWoche,
CNN International,
DRS3 Swiss public radio,
Deutsche Welle.

The German statistical office, in cooperation with the Bundesamt für Güterverkehr,  has taken the MAUT data in its portfolio of data products and their efforts can be found here. The Destatis document describing the data is here and here is their publication calendar for 2019.

Citation: “Nowcasting business cycles using toll data.” Journal of Forecasting 32:4 (2013): 299–306(with K. F. Zimmermann).
Toll Index April 2024

Starting in July 2018 the BAG – Bundesamt für Güterverkehr introduced yet another policy change which affected how lorries pay tolls within the MAUT system as well as the data that come out of this process which are used for computing the Toll Index. The change expanded the network of roads in which toll is due by adding all bundesstraßen to it.
While in the long run this is bound to make the Toll Index more accurate this introduced a discontinuity. The BAG even had difficulty producing the numbers timely for about year. After July 2019 we can report year on year changes for each month (with a missing value in 2018 for all months from July to December and a missing value in 2019 for all months from January to June.
The Toll Index was first proposed in IZA DP5522 which was published in the Journal of Forecasting. It has been widely covered in national and international media (selection):


Focus Magazin,
Tim Harford – The undercover economist,
Financial Times,
MoneyWeek,
WirtschaftsWoche,
CNN International,
DRS3 Swiss public radio,
Deutsche Welle.

The German statistical office, in cooperation with the Bundesamt für Güterverkehr,  has taken the MAUT data in its portfolio of data products and their efforts can be found here. The Destatis document describing the data is here and here is their publication calendar for 2019.

Citation: “Nowcasting business cycles using toll data.” Journal of Forecasting 32:4 (2013): 299–306(with K. F. Zimmermann).

Toll Index March 2024

Starting in July 2018 the BAG – Bundesamt für Güterverkehr introduced yet another policy change which affected how lorries pay tolls within the MAUT system as well as the data that come out of this process which are used for computing the Toll Index. The change expanded the network of roads in which toll is due by adding all bundesstraßen to it.
While in the long run this is bound to make the Toll Index more accurate this introduced a discontinuity. The BAG even had difficulty producing the numbers timely for about year. After July 2019 we can report year on year changes for each month (with a missing value in 2018 for all months from July to December and a missing value in 2019 for all months from January to June.
The Toll Index was first proposed in IZA DP5522 which was published in the Journal of Forecasting. It has been widely covered in national and international media (selection):


Focus Magazin,
Tim Harford – The undercover economist,
Financial Times,
MoneyWeek,
WirtschaftsWoche,
CNN International,
DRS3 Swiss public radio,
Deutsche Welle.

The German statistical office, in cooperation with the Bundesamt für Güterverkehr,  has taken the MAUT data in its portfolio of data products and their efforts can be found here. The Destatis document describing the data is here and here is their publication calendar for 2019.

Citation: “Nowcasting business cycles using toll data.” Journal of Forecasting 32:4 (2013): 299–306(with K. F. Zimmermann).