The Toll Index was first proposed in IZA DP5522 which was published in the Journal of Forecasting. It has been widely covered in national and international media (selection):
Focus Magazin,
Tim Harford – The undercover economist,
Financial Times,
MoneyWeek,
WirtschaftsWoche,
CNN International,
DRS3 Swiss public radio,
Deutsche Welle.
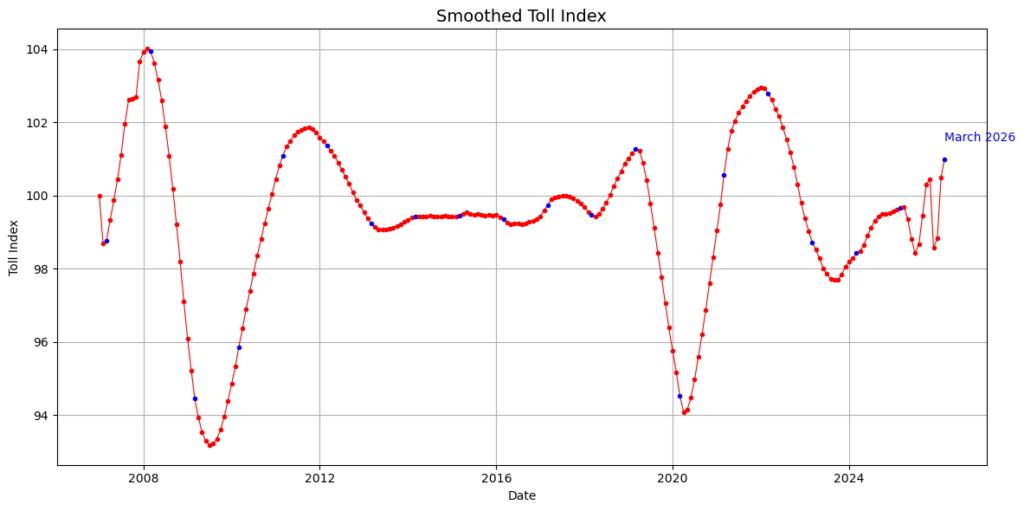
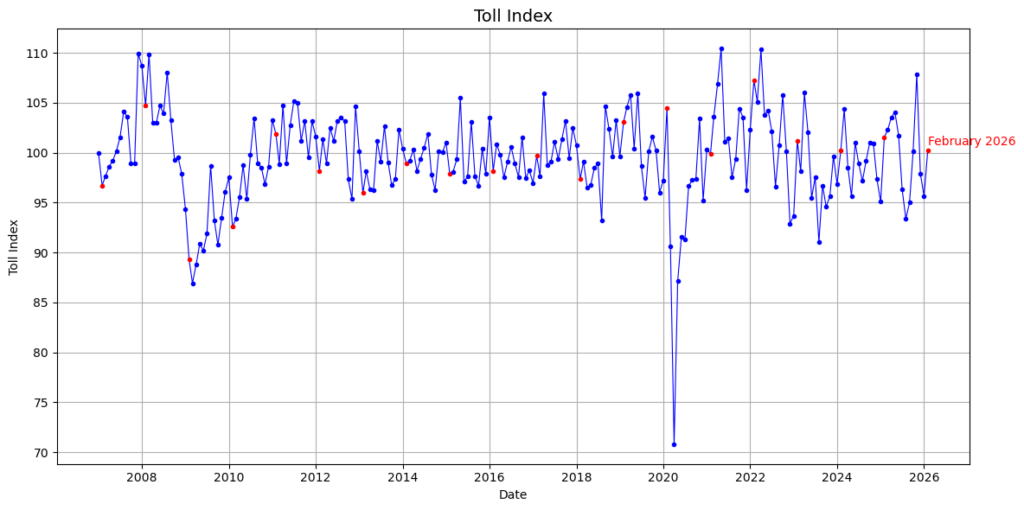
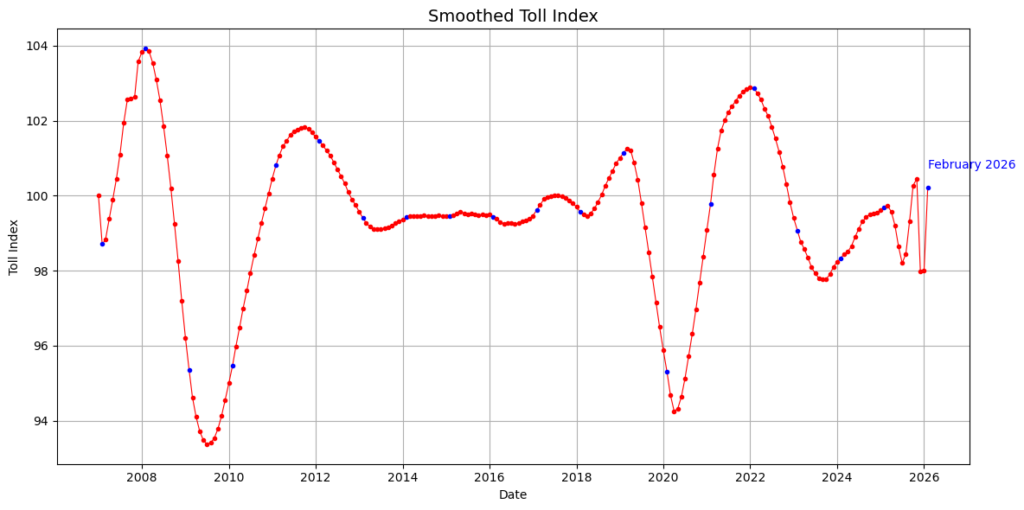
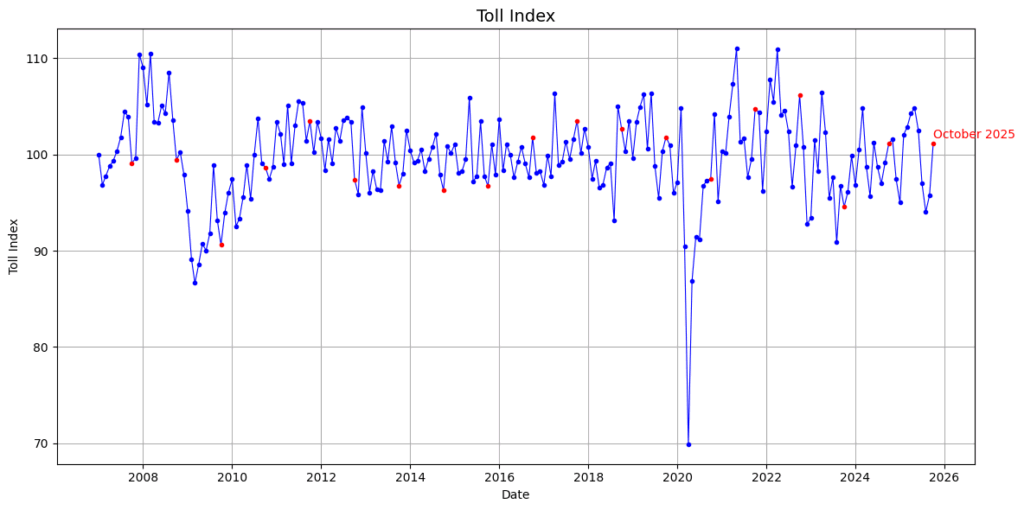
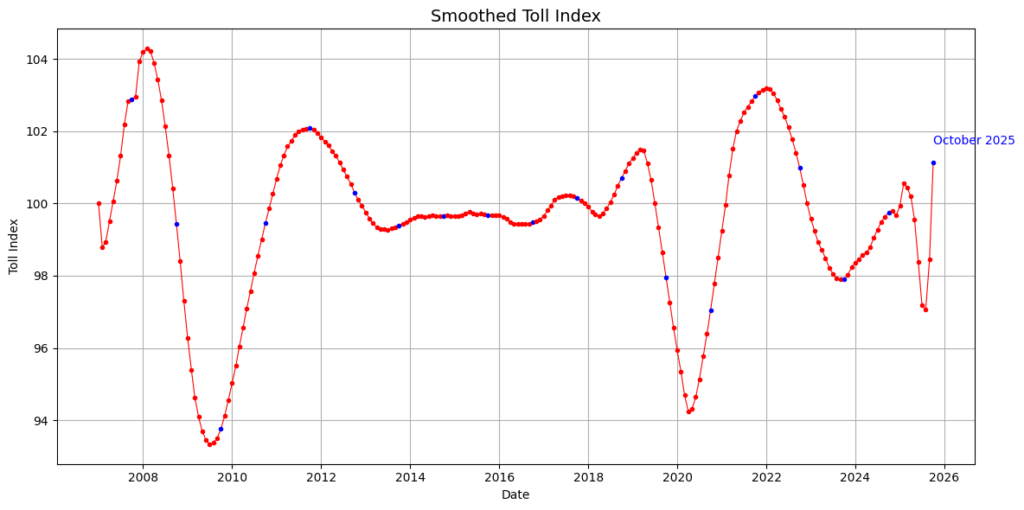
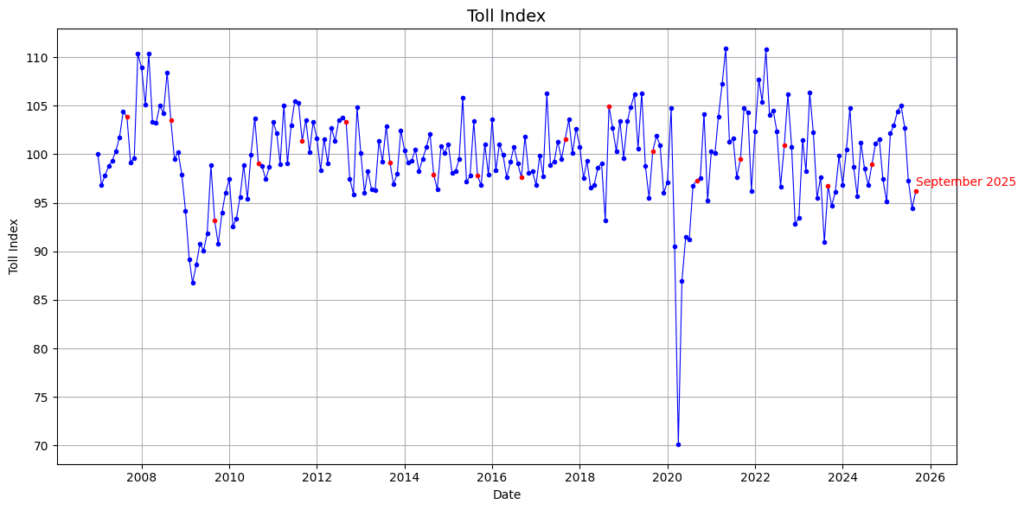
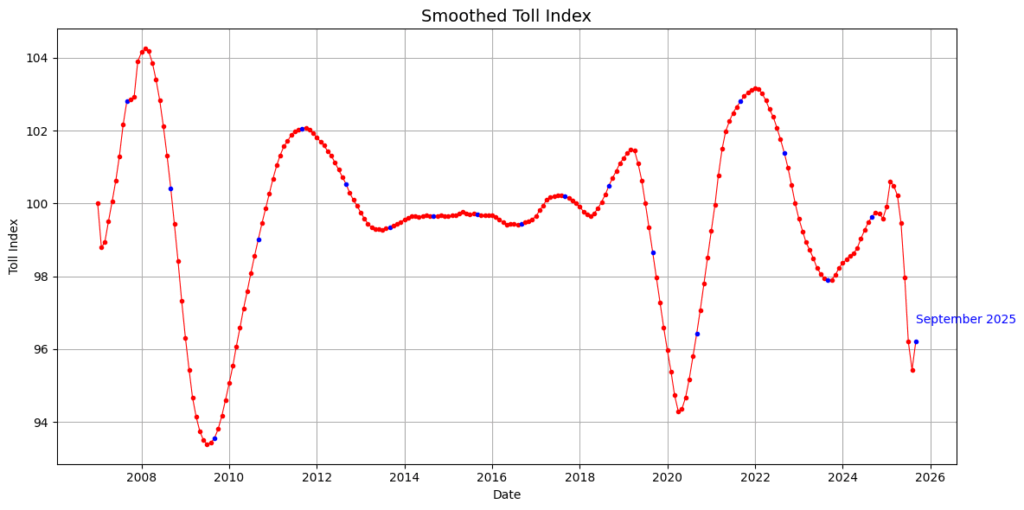
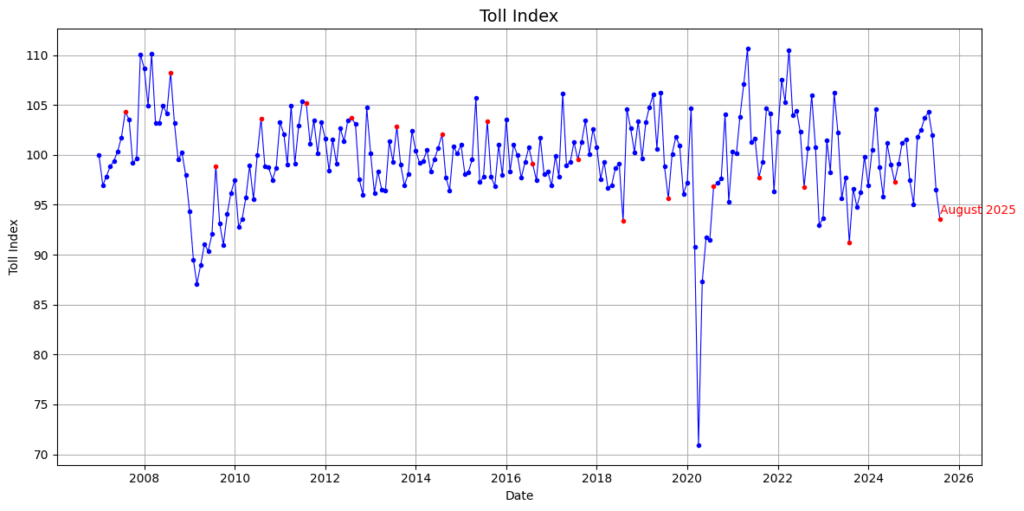
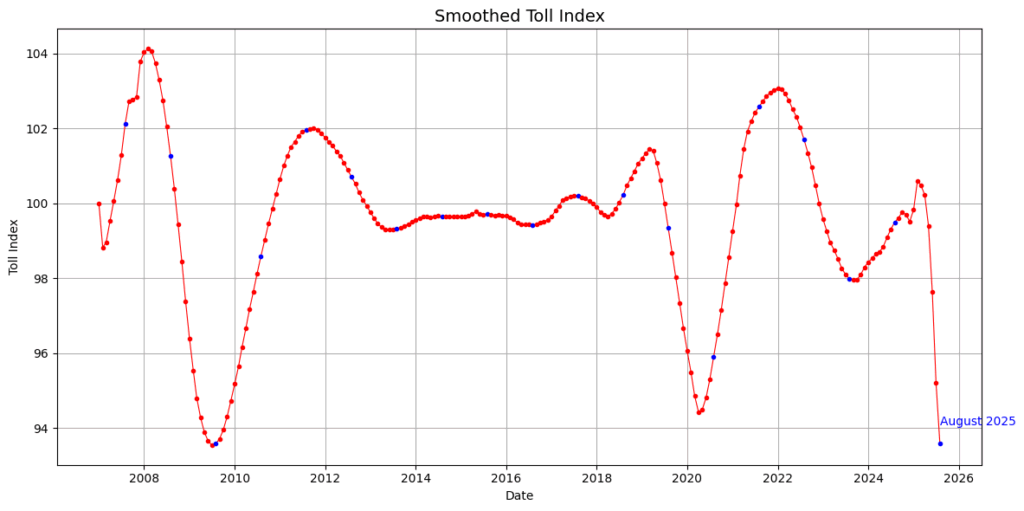
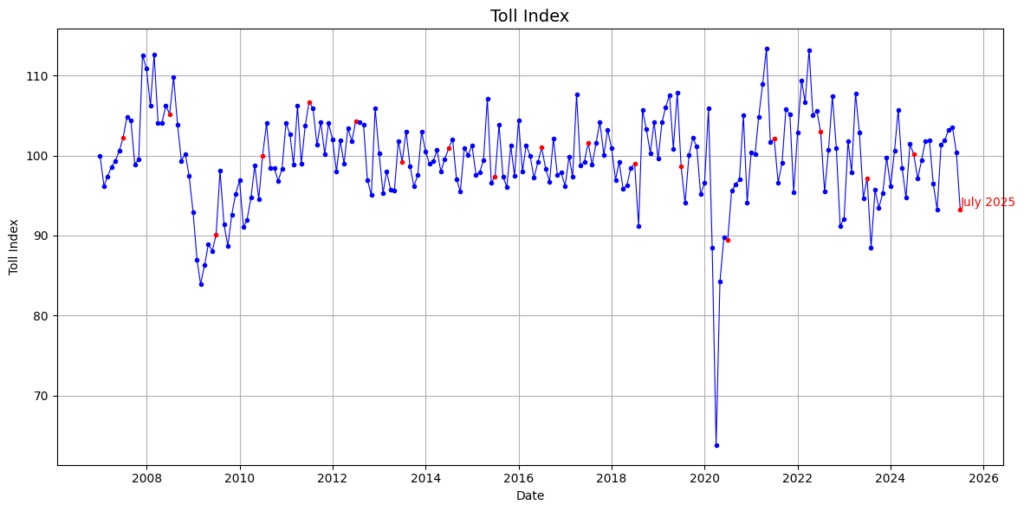
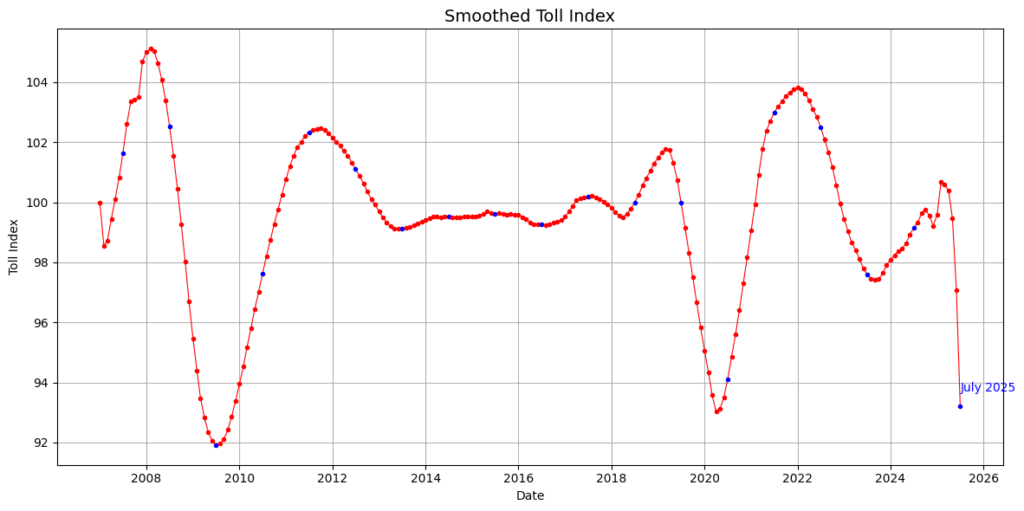
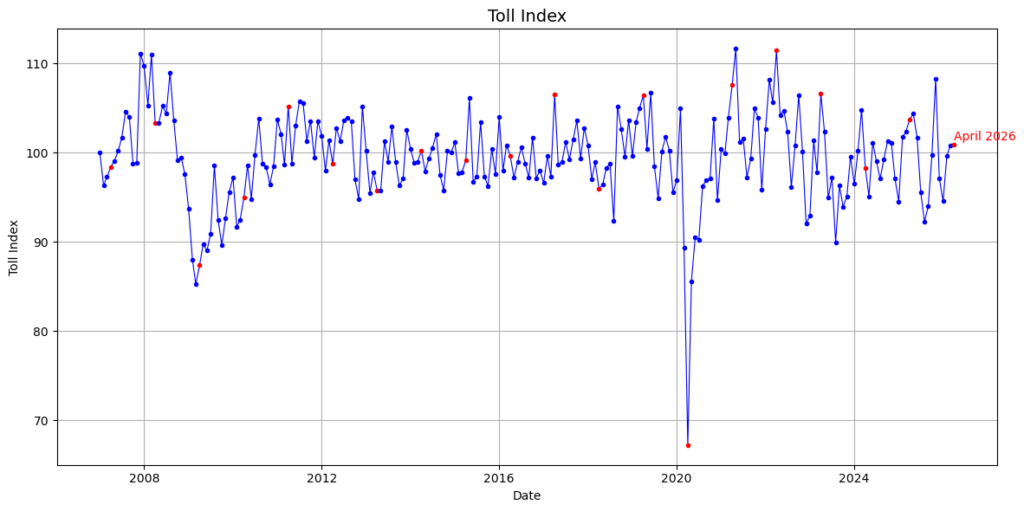
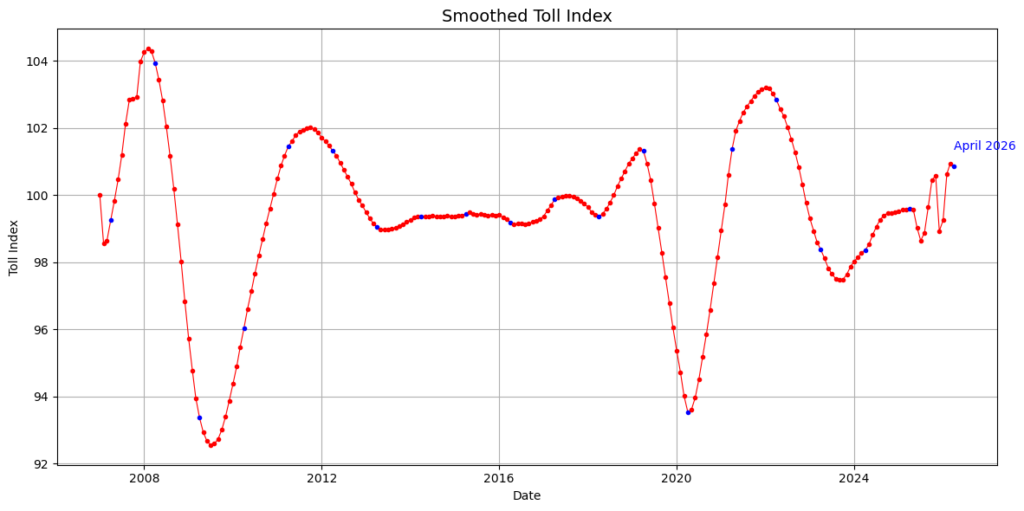
The Toll index was redefined in 2024 to account for various toll-related policy changes like including lighter trucks in the system or adding roads to the toll road network.
Citation: “Nowcasting business cycles using toll data.” Journal of Forecasting 32:4 (2013): 299–306(with K. F. Zimmermann).