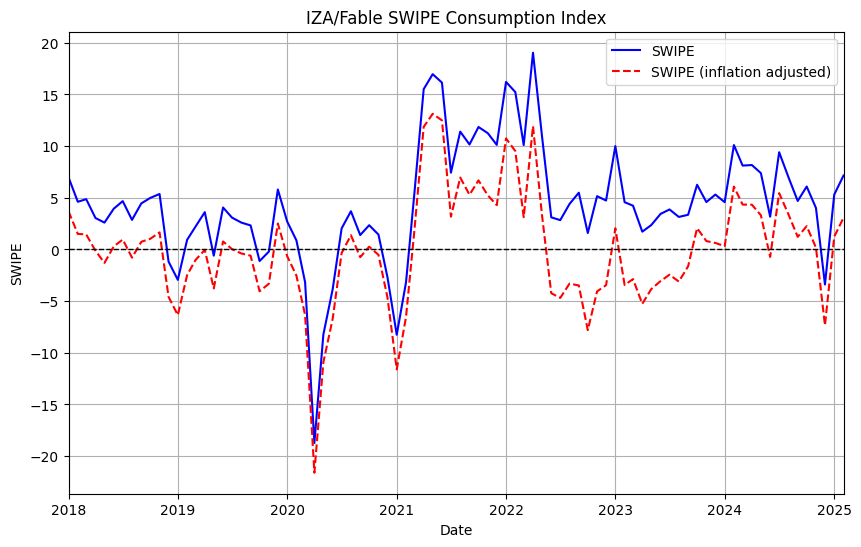
The 14-day month-to-date data for February 2025 shows a 7% year-over-year increase in consumption.
This initial “flash estimate” compares the first 14 days of February 2025 with the same period in February 2024 and should not be interpreted as the final year-over-year figure for February. As new data arrives daily, we will calculate 15-day, 16-day, and subsequent month-to-date partials until a stable value is reached, typically about three days into March. Stay tuned, and follow daily updates via the embedded live graph or at https://fable.radar.iza.org.
Note: The inflation-adjusted SWIPE index in the graph above assumes February 2025 inflation matches January 2025 levels.
Linke to Paper: The IZA/Fable Swipe Consumption Index